29
/
en
AIzaSyAYiBZKx7MnpbEhh9jyipgxe19OcubqV5w
April 1, 2024
113740
Cote d'Ivoire
CIV
true
2
1
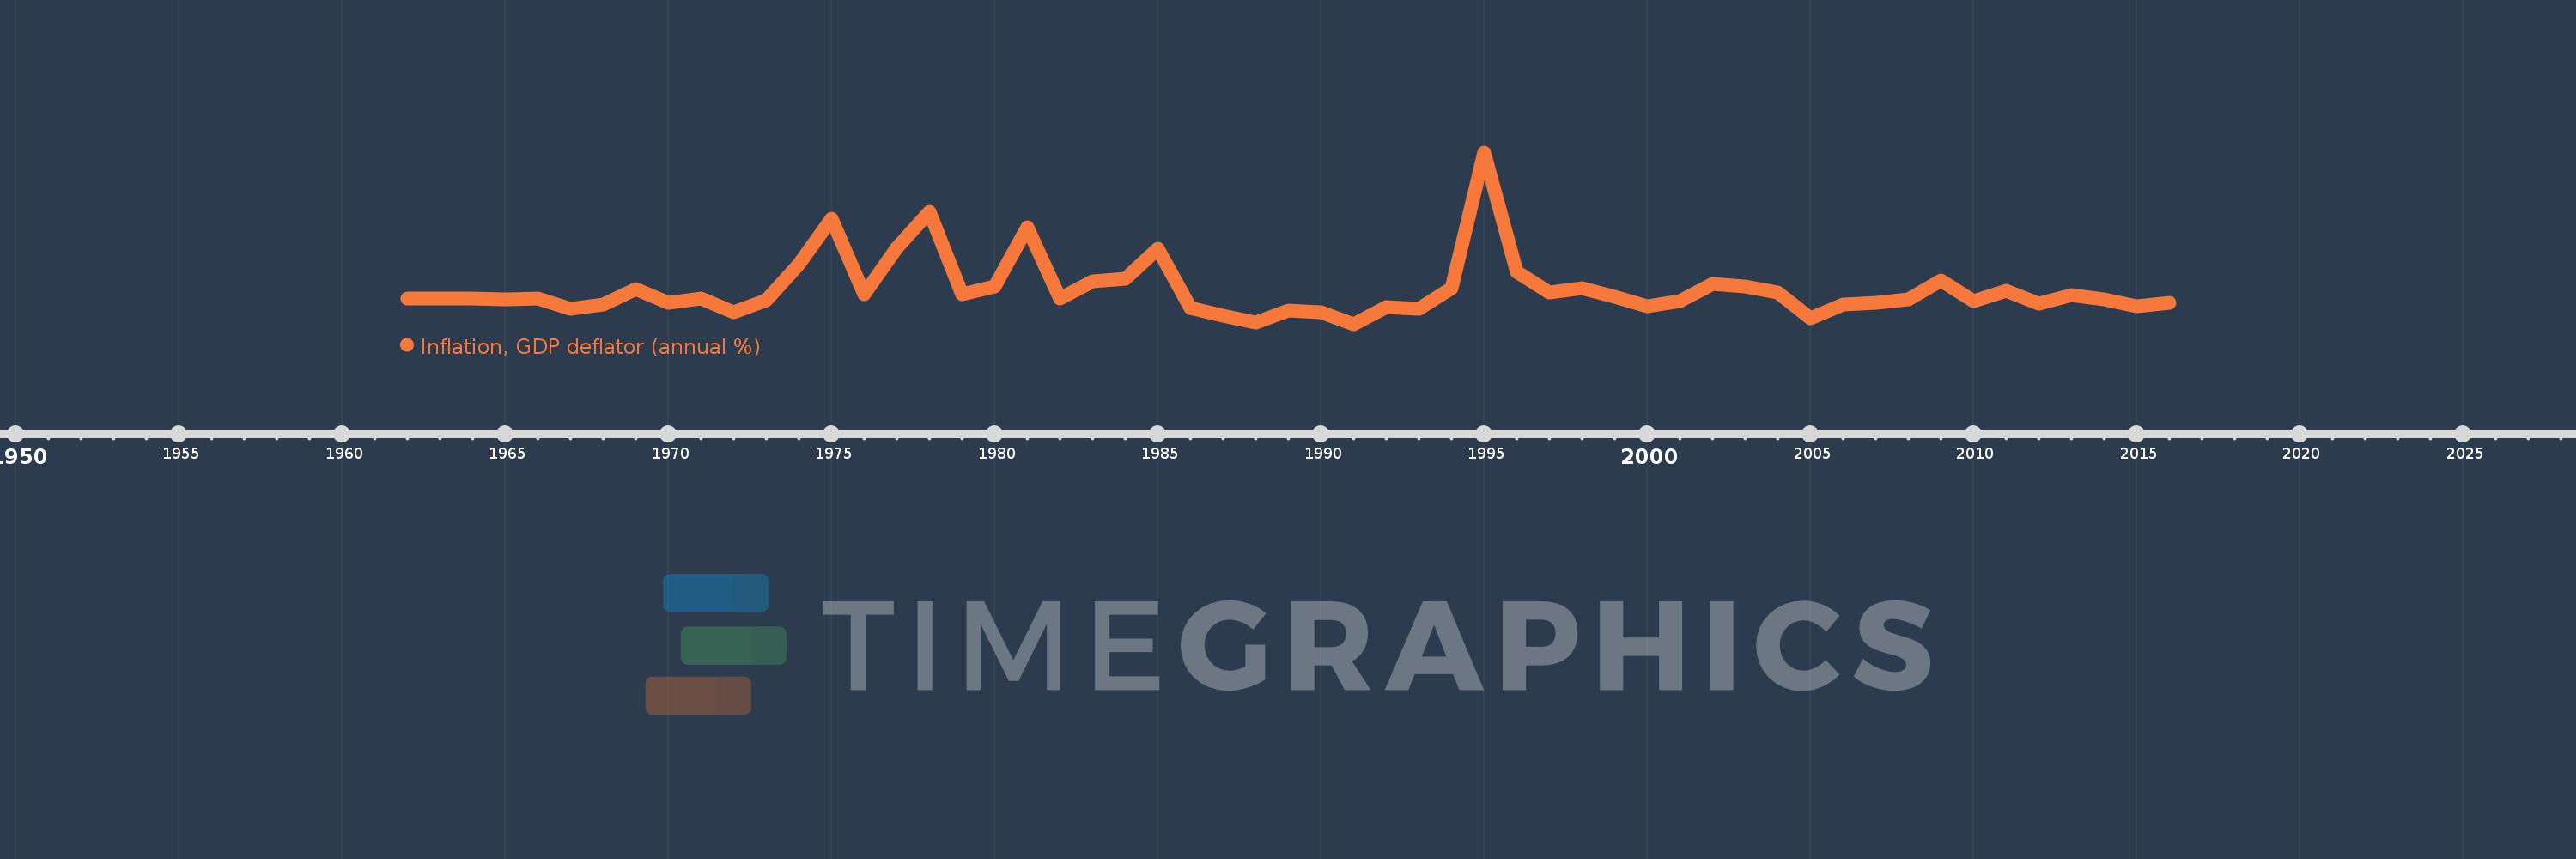
Inflation, GDP deflator (annual %)
2016,2015,2014,2013,2012,2011,2010,2009,2008,2007,2006,2005,2004,2003,2002,2001,2000,1999,1998,1997,1996,1995,1994,1993,1992,1991,1990,1989,1988,1987,1986,1985,1984,1983,1982,1981,1980,1979,1978,1977,1976,1975,1974,1973,1972,1971,1970,1969,1968,1967,1966,1965,1964,1963,1962
This statistics in other country:
AfghanistanAlbaniaAlgeriaAndorraAngolaAntigua and BarbudaArab WorldArgentinaArmeniaArubaAustraliaAustriaAzerbaijanBahamas, TheBahrainBangladeshBarbadosBelarusBelgiumBelizeBeninBermudaBhutanBoliviaBosnia and HerzegovinaBotswanaBrazilBrunei DarussalamBulgariaBurkina FasoBurundiCabo VerdeCambodiaCameroonCanadaCaribbean small statesCayman IslandsCentral African RepublicCentral Europe and the BalticsChadChannel IslandsChileChinaColombiaComorosCongo, Dem. Rep.Congo, Rep.Costa RicaCote d'IvoireCroatiaCubaCyprusCzech RepublicDenmarkDjiboutiDominicaDominican RepublicEarly-demographic dividendEast Asia & PacificEast Asia & Pacific (excluding high income)East Asia & Pacific (IDA & IBRD countries)EcuadorEgypt, Arab Rep.El SalvadorEquatorial GuineaEritreaEstoniaEthiopiaEuro areaEurope & Central AsiaEurope & Central Asia (excluding high income)Europe & Central Asia (IDA & IBRD countries)European UnionFijiFinlandFragile and conflict affected situationsFranceFrench PolynesiaGabonGambia, TheGeorgiaGermanyGhanaGreeceGreenlandGrenadaGuatemalaGuineaGuinea-BissauGuyanaHaitiHeavily indebted poor countries (HIPC)High incomeHondurasHong Kong SAR, ChinaHungaryIBRD onlyIcelandIDA & IBRD totalIDA blendIDA onlyIDA totalIndiaIndonesiaIran, Islamic Rep.IraqIrelandIsle of ManIsraelItalyJamaicaJapanJordanKazakhstanKenyaKiribatiKorea, Rep.KosovoKuwaitKyrgyz RepublicLao PDRLate-demographic dividendLatin America & Caribbean Latin America & Caribbean (excluding high income)Latin America & the Caribbean (IDA & IBRD countries)LatviaLeast developed countries: UN classificationLebanonLesothoLiberiaLibyaLiechtensteinLithuaniaLow & middle incomeLow incomeLower middle incomeLuxembourgMacao SAR, ChinaMacedonia, FYRMadagascarMalawiMalaysiaMaldivesMaliMaltaMarshall IslandsMauritaniaMauritiusMexicoMicronesia, Fed. Sts.Middle East & North AfricaMiddle East & North Africa (excluding high income)Middle East & North Africa (IDA & IBRD countries)Middle incomeMoldovaMonacoMongoliaMontenegroMoroccoMozambiqueMyanmarNamibiaNauruNepalNetherlandsNew CaledoniaNew ZealandNicaraguaNigerNigeriaNorth AmericaNorwayOECD membersOmanOther small statesPacific island small statesPakistanPalauPanamaPapua New GuineaParaguayPeruPhilippinesPolandPortugalPost-demographic dividendPre-demographic dividendPuerto RicoQatarRomaniaRussian FederationRwandaSamoaSan MarinoSao Tome and PrincipeSaudi ArabiaSenegalSerbiaSeychellesSierra LeoneSingaporeSlovak RepublicSloveniaSmall statesSolomon IslandsSomaliaSouth AfricaSouth AsiaSouth Asia (IDA & IBRD)South SudanSpainSri LankaSt. Kitts and NevisSt. LuciaSt. Vincent and the GrenadinesSub-Saharan Africa Sub-Saharan Africa (excluding high income)Sub-Saharan Africa (IDA & IBRD countries)SudanSurinameSwazilandSwedenSwitzerlandSyrian Arab RepublicTajikistanTanzaniaThailandTimor-LesteTogoTongaTrinidad and TobagoTunisiaTurkeyTurkmenistanTuvaluUgandaUkraineUnited Arab EmiratesUnited KingdomUnited StatesUpper middle incomeUruguayUzbekistanVanuatuVenezuela, RBVietnamVirgin Islands (U.S.)West Bank and GazaWorldYemen, Rep.ZambiaZimbabwe Timeline:
This timeline shows a graph from 1962 to 2016 of Cote d'Ivoire. No data until 1961. Number of actual observations by date: 55.
Source name:
World Development Indicators
Source organization:
World Bank national accounts data, and OECD National Accounts data files.
Categories, topics:
Economy & Growth
Last updated:
apr 23, 2017
Indicators value changes by year
Minimum:
-4.523
jan 1, 1991
Maximum:
46.386
jan 1, 1995
At the date of observation
Value
Absolute change
Change from previous value
jan 1, 1962
2.99
+2.99
0.0%
jan 1, 1963
3.005
+0.015
0.49%
jan 1, 1964
3.014
+0.009
0.3%
jan 1, 1965
2.906
-0.108
-3.57%
jan 1, 1966
3.079
+0.173
5.94%
jan 1, 1967
0.042
-3.037
-98.65%
jan 1, 1968
1.228
+1.186
2.85K%
jan 1, 1969
5.794
+4.566
371.9%
jan 1, 1970
1.854
-3.94
-68.0%
jan 1, 1971
2.991
+1.137
61.33%
jan 1, 1972
-0.941
-3.932
-131.47%
jan 1, 1973
2.512
+3.453
-366.88%
jan 1, 1974
13.228
+10.716
426.67%
jan 1, 1975
26.694
+13.466
101.8%
jan 1, 1976
4.314
-22.38
-83.84%
jan 1, 1977
18.223
+13.909
322.42%
jan 1, 1978
28.751
+10.528
57.77%
jan 1, 1979
4.433
-24.318
-84.58%
jan 1, 1980
6.541
+2.108
47.55%
jan 1, 1981
24.144
+17.602
269.09%
jan 1, 1982
2.977
-21.167
-87.67%
jan 1, 1983
8.301
+5.324
178.85%
jan 1, 1984
9.047
+0.745
8.98%
jan 1, 1985
17.91
+8.863
97.97%
jan 1, 1986
0.344
-17.566
-98.08%
jan 1, 1987
-2.02
-2.364
-687.91%
jan 1, 1988
-4.075
-2.055
101.7%
jan 1, 1989
-0.381
+3.694
-90.65%
jan 1, 1990
-1.012
-0.631
165.78%
jan 1, 1991
-4.523
-3.511
346.78%
jan 1, 1992
0.663
+5.187
-114.67%
jan 1, 1993
-0.024
-0.687
-103.59%
jan 1, 1994
6.154
+6.178
-25.92K%
jan 1, 1995
46.386
+40.232
653.73%
jan 1, 1996
11.044
-35.342
-76.19%
jan 1, 1997
4.983
-6.061
-54.88%
jan 1, 1998
6.202
+1.219
24.45%
jan 1, 1999
3.639
-2.562
-41.31%
jan 1, 2000
0.786
-2.853
-78.4%
jan 1, 2001
2.246
+1.46
185.66%
jan 1, 2002
7.396
+5.151
229.34%
jan 1, 2003
6.667
-0.729
-9.86%
jan 1, 2004
4.801
-1.866
-27.99%
jan 1, 2005
-2.891
-7.692
-160.21%
jan 1, 2006
1.301
+4.192
-145.02%
jan 1, 2007
1.744
+0.443
34.02%
jan 1, 2008
2.933
+1.189
68.18%
jan 1, 2009
8.503
+5.569
189.88%
jan 1, 2010
2.346
-6.157
-72.41%
jan 1, 2011
5.386
+3.041
129.63%
jan 1, 2012
1.635
-3.751
-69.64%
jan 1, 2013
4.117
+2.482
151.76%
jan 1, 2014
2.752
-1.366
-33.17%
jan 1, 2015
0.802
-1.95
-70.86%
jan 1, 2016
1.822
+1.02
127.16%
Ranking of countries by current statistics by years


Comments: