29
/
en
AIzaSyAYiBZKx7MnpbEhh9jyipgxe19OcubqV5w
April 1, 2024
24201
Arab World
ARB
false
2
1
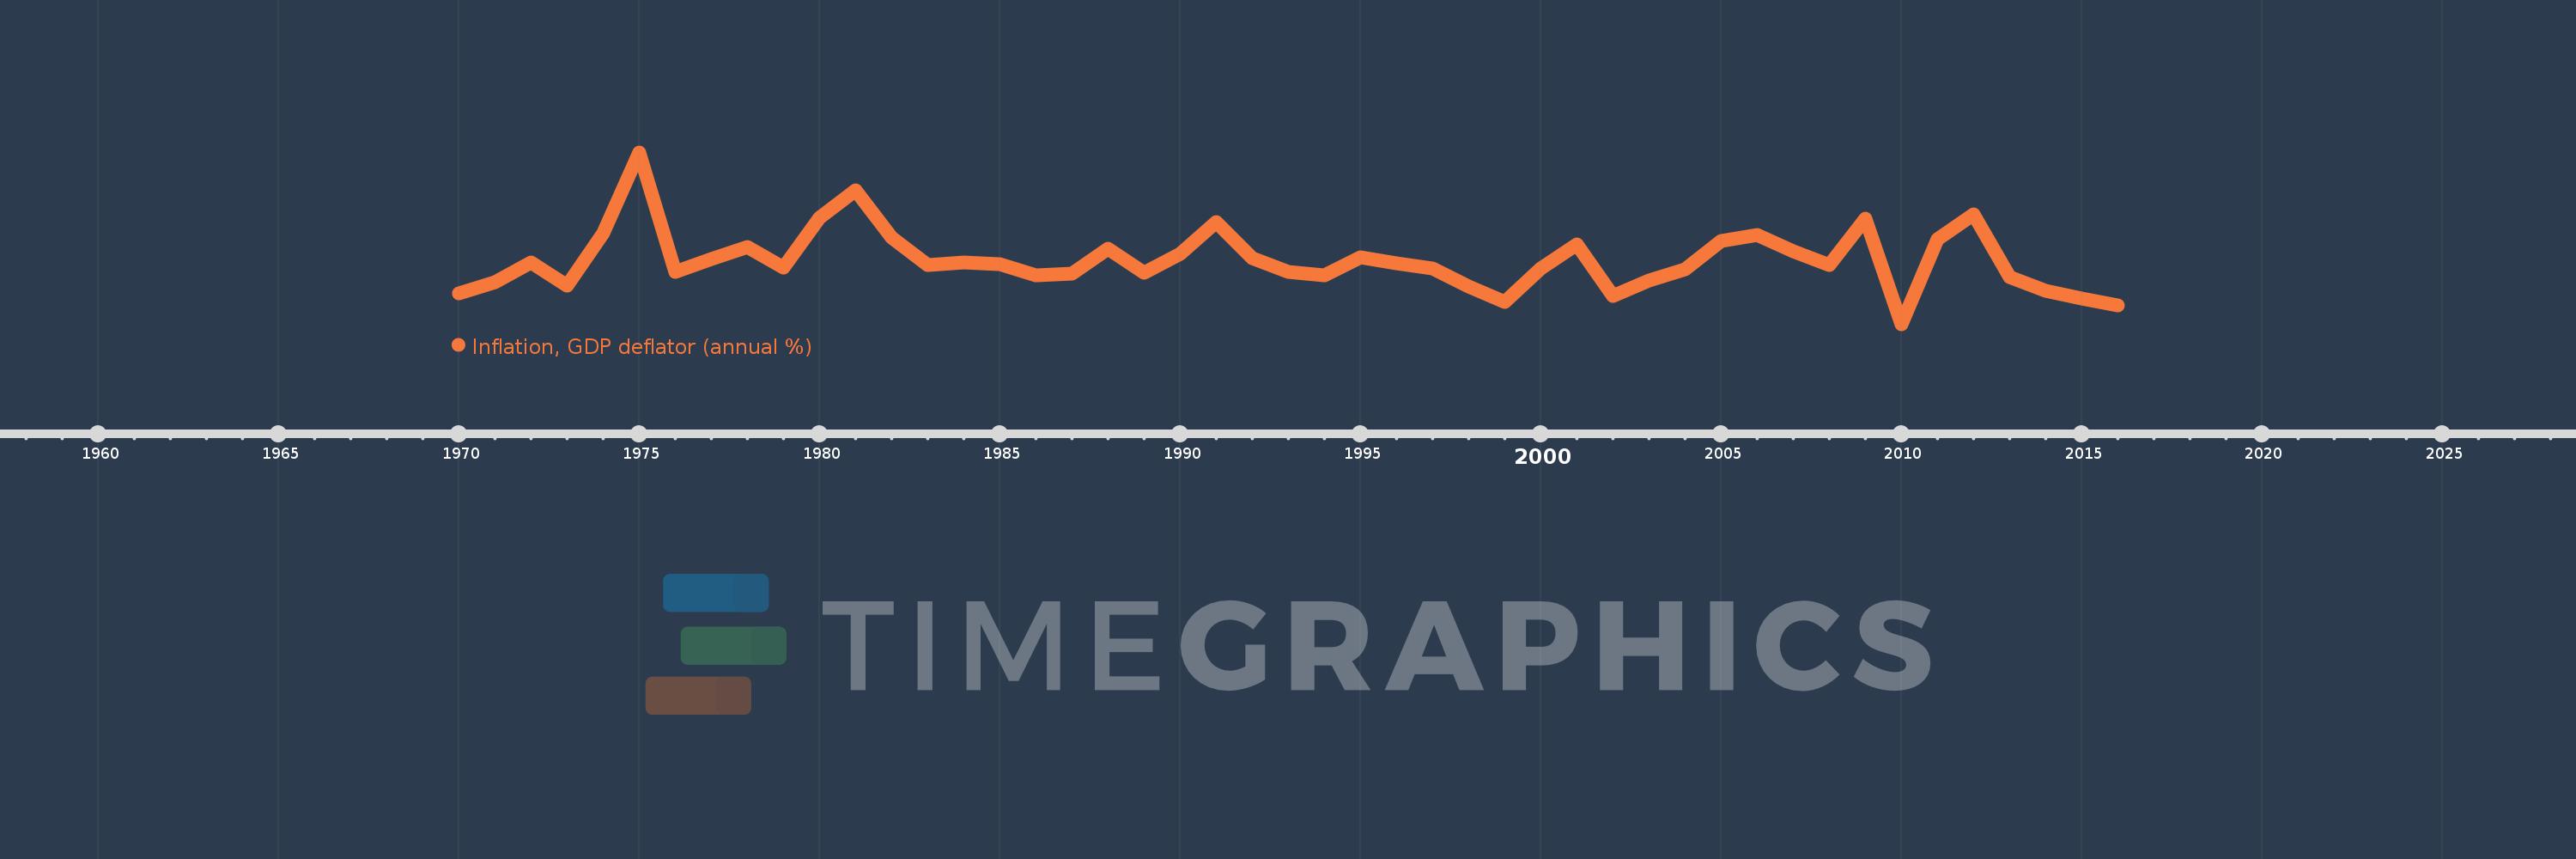
Inflation, GDP deflator (annual %)
2016,2015,2014,2013,2012,2011,2010,2009,2008,2007,2006,2005,2004,2003,2002,2001,2000,1999,1998,1997,1996,1995,1994,1993,1992,1991,1990,1989,1988,1987,1986,1985,1984,1983,1982,1981,1980,1979,1978,1977,1976,1975,1974,1973,1972,1971,1970
This statistics in other country:
AfghanistanAlbaniaAlgeriaAndorraAngolaAntigua and BarbudaArab WorldArgentinaArmeniaArubaAustraliaAustriaAzerbaijanBahamas, TheBahrainBangladeshBarbadosBelarusBelgiumBelizeBeninBermudaBhutanBoliviaBosnia and HerzegovinaBotswanaBrazilBrunei DarussalamBulgariaBurkina FasoBurundiCabo VerdeCambodiaCameroonCanadaCaribbean small statesCayman IslandsCentral African RepublicCentral Europe and the BalticsChadChannel IslandsChileChinaColombiaComorosCongo, Dem. Rep.Congo, Rep.Costa RicaCote d'IvoireCroatiaCubaCyprusCzech RepublicDenmarkDjiboutiDominicaDominican RepublicEarly-demographic dividendEast Asia & PacificEast Asia & Pacific (excluding high income)East Asia & Pacific (IDA & IBRD countries)EcuadorEgypt, Arab Rep.El SalvadorEquatorial GuineaEritreaEstoniaEthiopiaEuro areaEurope & Central AsiaEurope & Central Asia (excluding high income)Europe & Central Asia (IDA & IBRD countries)European UnionFijiFinlandFragile and conflict affected situationsFranceFrench PolynesiaGabonGambia, TheGeorgiaGermanyGhanaGreeceGreenlandGrenadaGuatemalaGuineaGuinea-BissauGuyanaHaitiHeavily indebted poor countries (HIPC)High incomeHondurasHong Kong SAR, ChinaHungaryIBRD onlyIcelandIDA & IBRD totalIDA blendIDA onlyIDA totalIndiaIndonesiaIran, Islamic Rep.IraqIrelandIsle of ManIsraelItalyJamaicaJapanJordanKazakhstanKenyaKiribatiKorea, Rep.KosovoKuwaitKyrgyz RepublicLao PDRLate-demographic dividendLatin America & Caribbean Latin America & Caribbean (excluding high income)Latin America & the Caribbean (IDA & IBRD countries)LatviaLeast developed countries: UN classificationLebanonLesothoLiberiaLibyaLiechtensteinLithuaniaLow & middle incomeLow incomeLower middle incomeLuxembourgMacao SAR, ChinaMacedonia, FYRMadagascarMalawiMalaysiaMaldivesMaliMaltaMarshall IslandsMauritaniaMauritiusMexicoMicronesia, Fed. Sts.Middle East & North AfricaMiddle East & North Africa (excluding high income)Middle East & North Africa (IDA & IBRD countries)Middle incomeMoldovaMonacoMongoliaMontenegroMoroccoMozambiqueMyanmarNamibiaNauruNepalNetherlandsNew CaledoniaNew ZealandNicaraguaNigerNigeriaNorth AmericaNorwayOECD membersOmanOther small statesPacific island small statesPakistanPalauPanamaPapua New GuineaParaguayPeruPhilippinesPolandPortugalPost-demographic dividendPre-demographic dividendPuerto RicoQatarRomaniaRussian FederationRwandaSamoaSan MarinoSao Tome and PrincipeSaudi ArabiaSenegalSerbiaSeychellesSierra LeoneSingaporeSlovak RepublicSloveniaSmall statesSolomon IslandsSomaliaSouth AfricaSouth AsiaSouth Asia (IDA & IBRD)South SudanSpainSri LankaSt. Kitts and NevisSt. LuciaSt. Vincent and the GrenadinesSub-Saharan Africa Sub-Saharan Africa (excluding high income)Sub-Saharan Africa (IDA & IBRD countries)SudanSurinameSwazilandSwedenSwitzerlandSyrian Arab RepublicTajikistanTanzaniaThailandTimor-LesteTogoTongaTrinidad and TobagoTunisiaTurkeyTurkmenistanTuvaluUgandaUkraineUnited Arab EmiratesUnited KingdomUnited StatesUpper middle incomeUruguayUzbekistanVanuatuVenezuela, RBVietnamVirgin Islands (U.S.)West Bank and GazaWorldYemen, Rep.ZambiaZimbabwe Timeline:
This timeline shows a graph from 1970 to 2016 of Arab World. No data until 1969. Number of actual observations by date: 47.
Source name:
World Development Indicators
Source organization:
World Bank national accounts data, and OECD National Accounts data files.
Categories, topics:
Economy & Growth
Last updated:
apr 23, 2017
Indicators value changes by year
Minimum:
-4.366
jan 1, 2010
Maximum:
26.923
jan 1, 1975
At the date of observation
Value
Absolute change
Change from previous value
jan 1, 1970
1.304
+1.304
0.0%
jan 1, 1971
3.236
+1.932
148.2%
jan 1, 1972
6.885
+3.649
112.76%
jan 1, 1973
2.699
-4.186
-60.8%
jan 1, 1974
12.183
+9.484
351.39%
jan 1, 1975
26.923
+14.74
120.99%
jan 1, 1976
5.139
-21.783
-80.91%
jan 1, 1977
7.525
+2.385
46.41%
jan 1, 1978
9.724
+2.199
29.23%
jan 1, 1979
5.925
-3.799
-39.07%
jan 1, 1980
15.051
+9.125
154.01%
jan 1, 1981
20.028
+4.978
33.07%
jan 1, 1982
11.432
-8.596
-42.92%
jan 1, 1983
6.414
-5.018
-43.9%
jan 1, 1984
6.887
+0.474
7.39%
jan 1, 1985
6.591
-0.296
-4.3%
jan 1, 1986
4.478
-2.113
-32.05%
jan 1, 1987
4.884
+0.406
9.06%
jan 1, 1988
9.368
+4.484
91.81%
jan 1, 1989
5.034
-4.334
-46.27%
jan 1, 1990
8.402
+3.368
66.9%
jan 1, 1991
14.283
+5.881
70.0%
jan 1, 1992
7.611
-6.672
-46.72%
jan 1, 1993
5.119
-2.492
-32.74%
jan 1, 1994
4.546
-0.573
-11.2%
jan 1, 1995
7.89
+3.344
73.57%
jan 1, 1996
6.684
-1.206
-15.28%
jan 1, 1997
5.773
-0.911
-13.63%
jan 1, 1998
2.52
-3.253
-56.35%
jan 1, 1999
-0.299
-2.819
-111.88%
jan 1, 2000
5.812
+6.111
-2.04K%
jan 1, 2001
10.148
+4.336
74.61%
jan 1, 2002
0.78
-9.368
-92.32%
jan 1, 2003
3.565
+2.785
357.14%
jan 1, 2004
5.705
+2.14
60.03%
jan 1, 2005
10.85
+5.145
90.2%
jan 1, 2006
11.966
+1.116
10.29%
jan 1, 2007
8.843
-3.124
-26.11%
jan 1, 2008
6.395
-2.447
-27.68%
jan 1, 2009
14.786
+8.391
131.21%
jan 1, 2010
-4.366
-19.152
-129.53%
jan 1, 2011
11.085
+15.45
-353.9%
jan 1, 2012
15.693
+4.609
41.58%
jan 1, 2013
4.194
-11.499
-73.28%
jan 1, 2014
1.74
-2.454
-58.51%
jan 1, 2015
0.347
-1.393
-80.04%
jan 1, 2016
-0.998
-1.346
-387.43%
Ranking of countries by current statistics by years


Comments: