29
/
en
AIzaSyAYiBZKx7MnpbEhh9jyipgxe19OcubqV5w
April 1, 2024
180617
Liechtenstein
LIE
true
2
1
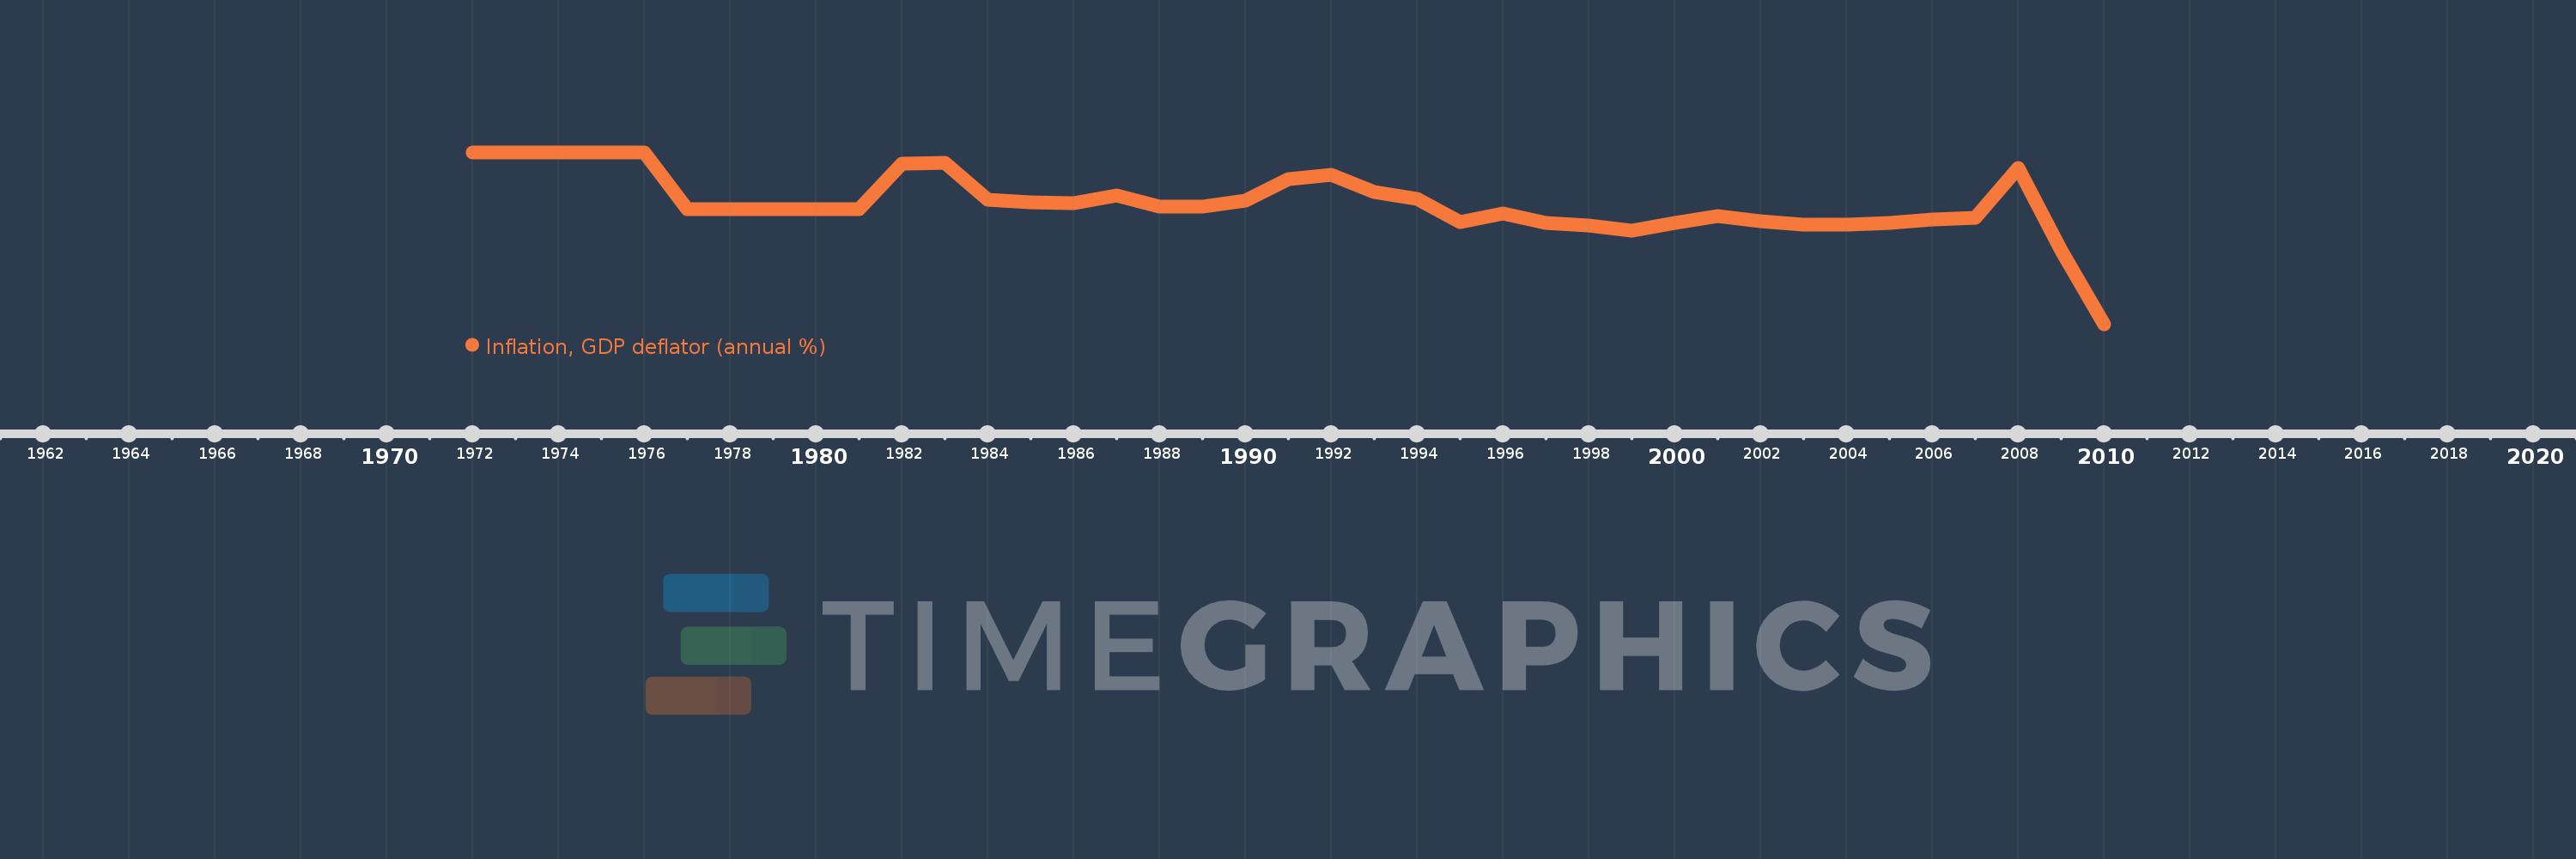
Inflation, GDP deflator (annual %)
2010,2009,2008,2007,2006,2005,2004,2003,2002,2001,2000,1999,1998,1997,1996,1995,1994,1993,1992,1991,1990,1989,1988,1987,1986,1985,1984,1983,1982,1981,1980,1979,1978,1977,1976,1975,1974,1973,1972
This statistics in other country:
AfghanistanAlbaniaAlgeriaAndorraAngolaAntigua and BarbudaArab WorldArgentinaArmeniaArubaAustraliaAustriaAzerbaijanBahamas, TheBahrainBangladeshBarbadosBelarusBelgiumBelizeBeninBermudaBhutanBoliviaBosnia and HerzegovinaBotswanaBrazilBrunei DarussalamBulgariaBurkina FasoBurundiCabo VerdeCambodiaCameroonCanadaCaribbean small statesCayman IslandsCentral African RepublicCentral Europe and the BalticsChadChannel IslandsChileChinaColombiaComorosCongo, Dem. Rep.Congo, Rep.Costa RicaCote d'IvoireCroatiaCubaCyprusCzech RepublicDenmarkDjiboutiDominicaDominican RepublicEarly-demographic dividendEast Asia & PacificEast Asia & Pacific (excluding high income)East Asia & Pacific (IDA & IBRD countries)EcuadorEgypt, Arab Rep.El SalvadorEquatorial GuineaEritreaEstoniaEthiopiaEuro areaEurope & Central AsiaEurope & Central Asia (excluding high income)Europe & Central Asia (IDA & IBRD countries)European UnionFijiFinlandFragile and conflict affected situationsFranceFrench PolynesiaGabonGambia, TheGeorgiaGermanyGhanaGreeceGreenlandGrenadaGuatemalaGuineaGuinea-BissauGuyanaHaitiHeavily indebted poor countries (HIPC)High incomeHondurasHong Kong SAR, ChinaHungaryIBRD onlyIcelandIDA & IBRD totalIDA blendIDA onlyIDA totalIndiaIndonesiaIran, Islamic Rep.IraqIrelandIsle of ManIsraelItalyJamaicaJapanJordanKazakhstanKenyaKiribatiKorea, Rep.KosovoKuwaitKyrgyz RepublicLao PDRLate-demographic dividendLatin America & Caribbean Latin America & Caribbean (excluding high income)Latin America & the Caribbean (IDA & IBRD countries)LatviaLeast developed countries: UN classificationLebanonLesothoLiberiaLibyaLiechtensteinLithuaniaLow & middle incomeLow incomeLower middle incomeLuxembourgMacao SAR, ChinaMacedonia, FYRMadagascarMalawiMalaysiaMaldivesMaliMaltaMarshall IslandsMauritaniaMauritiusMexicoMicronesia, Fed. Sts.Middle East & North AfricaMiddle East & North Africa (excluding high income)Middle East & North Africa (IDA & IBRD countries)Middle incomeMoldovaMonacoMongoliaMontenegroMoroccoMozambiqueMyanmarNamibiaNauruNepalNetherlandsNew CaledoniaNew ZealandNicaraguaNigerNigeriaNorth AmericaNorwayOECD membersOmanOther small statesPacific island small statesPakistanPalauPanamaPapua New GuineaParaguayPeruPhilippinesPolandPortugalPost-demographic dividendPre-demographic dividendPuerto RicoQatarRomaniaRussian FederationRwandaSamoaSan MarinoSao Tome and PrincipeSaudi ArabiaSenegalSerbiaSeychellesSierra LeoneSingaporeSlovak RepublicSloveniaSmall statesSolomon IslandsSomaliaSouth AfricaSouth AsiaSouth Asia (IDA & IBRD)South SudanSpainSri LankaSt. Kitts and NevisSt. LuciaSt. Vincent and the GrenadinesSub-Saharan Africa Sub-Saharan Africa (excluding high income)Sub-Saharan Africa (IDA & IBRD countries)SudanSurinameSwazilandSwedenSwitzerlandSyrian Arab RepublicTajikistanTanzaniaThailandTimor-LesteTogoTongaTrinidad and TobagoTunisiaTurkeyTurkmenistanTuvaluUgandaUkraineUnited Arab EmiratesUnited KingdomUnited StatesUpper middle incomeUruguayUzbekistanVanuatuVenezuela, RBVietnamVirgin Islands (U.S.)West Bank and GazaWorldYemen, Rep.ZambiaZimbabwe Timeline:
This timeline shows a graph from 1972 to 2010 of Liechtenstein. No data until 1971. Number of actual observations by date: 39.
Source name:
World Development Indicators
Source organization:
World Bank national accounts data, and OECD National Accounts data files.
Categories, topics:
Economy & Growth
Last updated:
apr 23, 2017
Indicators value changes by year
Minimum:
-9.901
jan 1, 2010
At the date of observation
Value
Absolute change
Change from previous value
jan 1, 1972
8.244
+8.244
0.0%
jan 1, 1973
8.244
+0.0
0.0%
jan 1, 1974
8.244
0.0
0.0%
jan 1, 1975
8.244
0.0
0.0%
jan 1, 1976
8.244
0.0
0.0%
jan 1, 1977
2.23
-6.013
-72.94%
jan 1, 1978
2.23
+0.0
0.0%
jan 1, 1980
2.23
+0.0
0.0%
jan 1, 1982
7.013
+4.782
214.41%
jan 1, 1983
7.177
+0.164
2.34%
jan 1, 1984
3.218
-3.959
-55.17%
jan 1, 1985
2.951
-0.266
-8.27%
jan 1, 1986
2.855
-0.096
-3.26%
jan 1, 1987
3.698
+0.843
29.53%
jan 1, 1988
2.52
-1.179
-31.87%
jan 1, 1989
2.505
-0.014
-0.56%
jan 1, 1990
3.144
+0.639
25.49%
jan 1, 1991
5.402
+2.259
71.84%
jan 1, 1992
5.87
+0.468
8.66%
jan 1, 1993
4.024
-1.847
-31.46%
jan 1, 1994
3.302
-0.722
-17.94%
jan 1, 1995
0.852
-2.45
-74.19%
jan 1, 1996
1.796
+0.944
110.7%
jan 1, 1997
0.815
-0.981
-54.6%
jan 1, 1998
0.515
-0.301
-36.88%
jan 1, 1999
0.015
-0.5
-97.16%
jan 1, 2000
0.819
+0.805
5.5K%
jan 1, 2001
1.553
+0.733
89.52%
jan 1, 2002
0.986
-0.567
-36.5%
jan 1, 2003
0.651
-0.335
-33.98%
jan 1, 2004
0.633
-0.018
-2.81%
jan 1, 2005
0.81
+0.178
28.08%
jan 1, 2006
1.191
+0.38
46.95%
jan 1, 2007
1.315
+0.124
10.44%
jan 1, 2008
6.582
+5.267
400.56%
jan 1, 2009
-2.117
-8.698
-132.16%
jan 1, 2010
-9.901
-7.784
367.74%
Ranking of countries by current statistics by years


Comments: