29
/
en
AIzaSyAYiBZKx7MnpbEhh9jyipgxe19OcubqV5w
April 1, 2024
105019
Chile
CHL
true
2
1
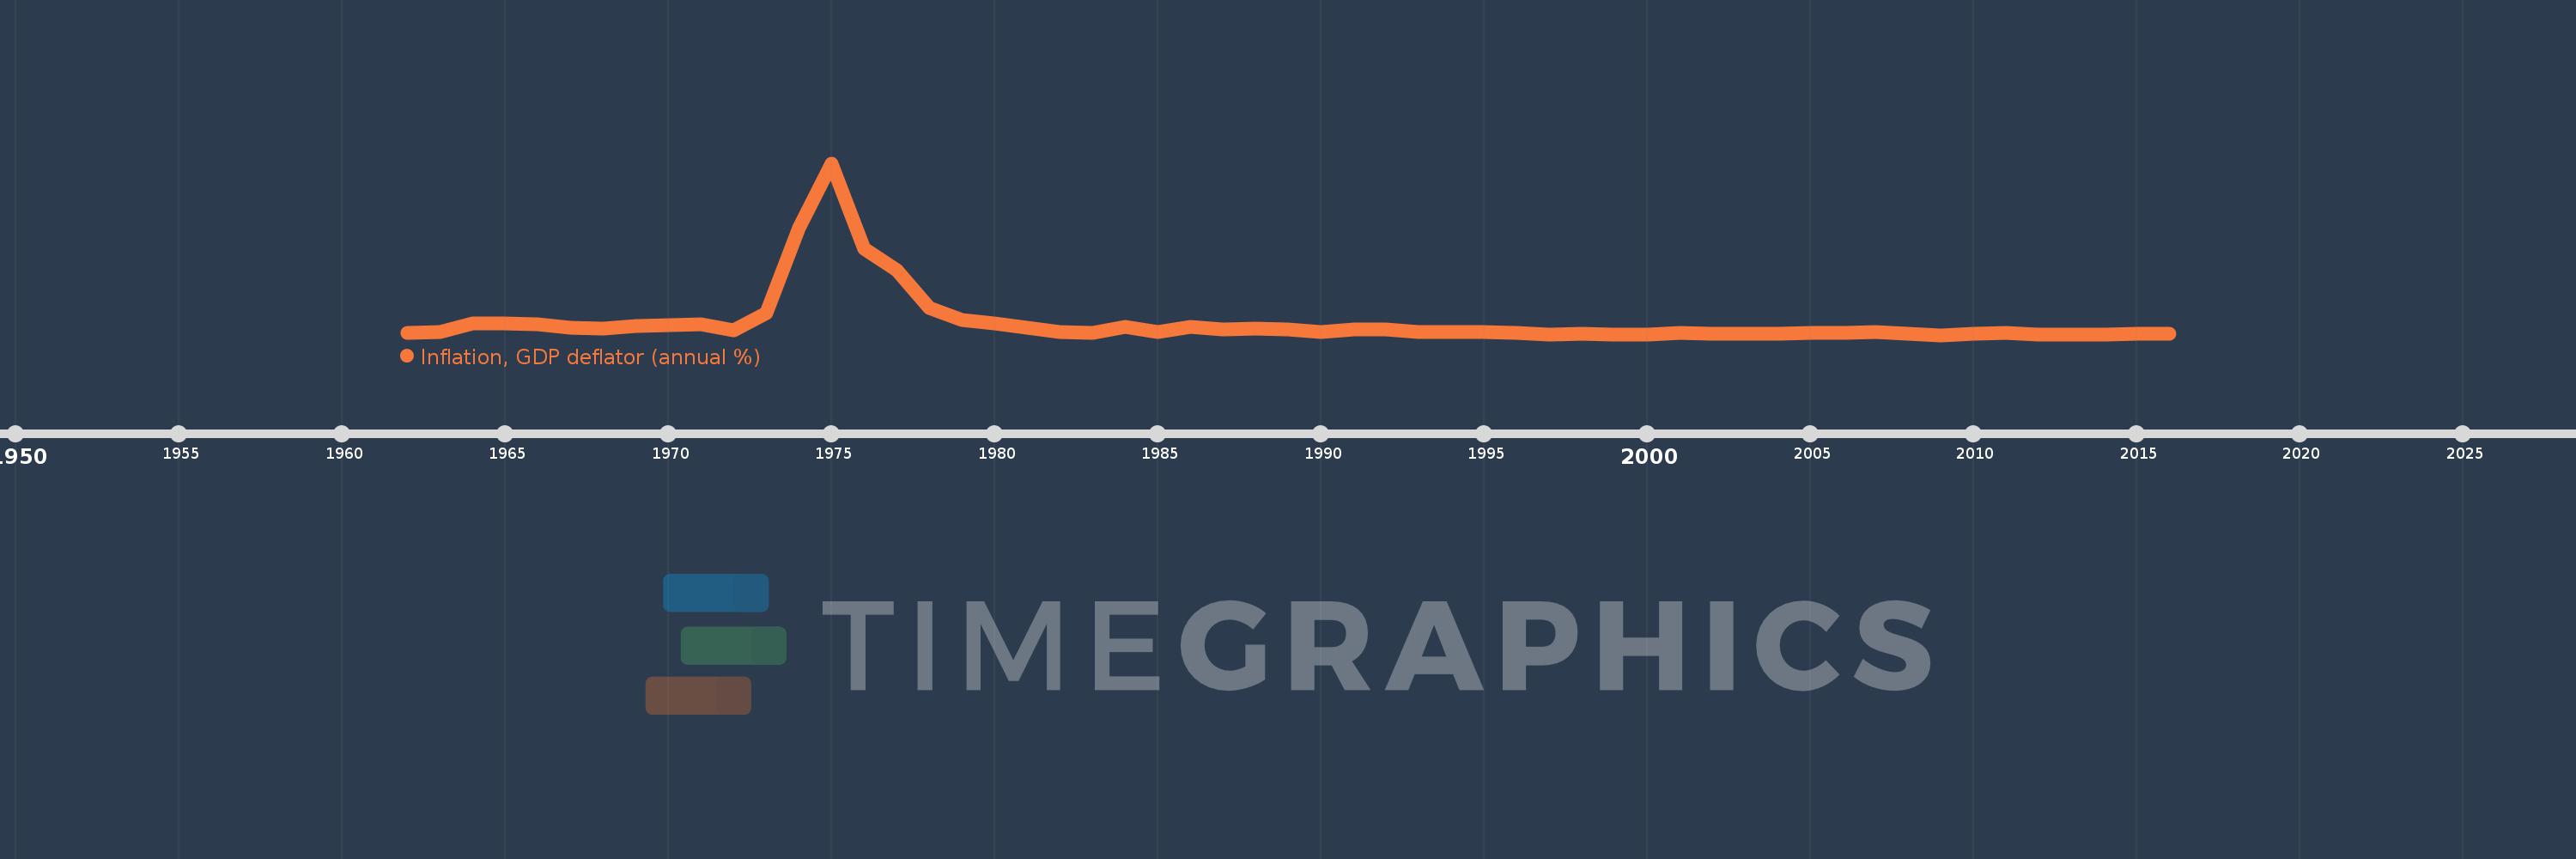
Inflation, GDP deflator (annual %)
2016,2015,2014,2013,2012,2011,2010,2009,2008,2007,2006,2005,2004,2003,2002,2001,2000,1999,1998,1997,1996,1995,1994,1993,1992,1991,1990,1989,1988,1987,1986,1985,1984,1983,1982,1981,1980,1979,1978,1977,1976,1975,1974,1973,1972,1971,1970,1969,1968,1967,1966,1965,1964,1963,1962
This statistics in other country:
AfghanistanAlbaniaAlgeriaAndorraAngolaAntigua and BarbudaArab WorldArgentinaArmeniaArubaAustraliaAustriaAzerbaijanBahamas, TheBahrainBangladeshBarbadosBelarusBelgiumBelizeBeninBermudaBhutanBoliviaBosnia and HerzegovinaBotswanaBrazilBrunei DarussalamBulgariaBurkina FasoBurundiCabo VerdeCambodiaCameroonCanadaCaribbean small statesCayman IslandsCentral African RepublicCentral Europe and the BalticsChadChannel IslandsChileChinaColombiaComorosCongo, Dem. Rep.Congo, Rep.Costa RicaCote d'IvoireCroatiaCubaCyprusCzech RepublicDenmarkDjiboutiDominicaDominican RepublicEarly-demographic dividendEast Asia & PacificEast Asia & Pacific (excluding high income)East Asia & Pacific (IDA & IBRD countries)EcuadorEgypt, Arab Rep.El SalvadorEquatorial GuineaEritreaEstoniaEthiopiaEuro areaEurope & Central AsiaEurope & Central Asia (excluding high income)Europe & Central Asia (IDA & IBRD countries)European UnionFijiFinlandFragile and conflict affected situationsFranceFrench PolynesiaGabonGambia, TheGeorgiaGermanyGhanaGreeceGreenlandGrenadaGuatemalaGuineaGuinea-BissauGuyanaHaitiHeavily indebted poor countries (HIPC)High incomeHondurasHong Kong SAR, ChinaHungaryIBRD onlyIcelandIDA & IBRD totalIDA blendIDA onlyIDA totalIndiaIndonesiaIran, Islamic Rep.IraqIrelandIsle of ManIsraelItalyJamaicaJapanJordanKazakhstanKenyaKiribatiKorea, Rep.KosovoKuwaitKyrgyz RepublicLao PDRLate-demographic dividendLatin America & Caribbean Latin America & Caribbean (excluding high income)Latin America & the Caribbean (IDA & IBRD countries)LatviaLeast developed countries: UN classificationLebanonLesothoLiberiaLibyaLiechtensteinLithuaniaLow & middle incomeLow incomeLower middle incomeLuxembourgMacao SAR, ChinaMacedonia, FYRMadagascarMalawiMalaysiaMaldivesMaliMaltaMarshall IslandsMauritaniaMauritiusMexicoMicronesia, Fed. Sts.Middle East & North AfricaMiddle East & North Africa (excluding high income)Middle East & North Africa (IDA & IBRD countries)Middle incomeMoldovaMonacoMongoliaMontenegroMoroccoMozambiqueMyanmarNamibiaNauruNepalNetherlandsNew CaledoniaNew ZealandNicaraguaNigerNigeriaNorth AmericaNorwayOECD membersOmanOther small statesPacific island small statesPakistanPalauPanamaPapua New GuineaParaguayPeruPhilippinesPolandPortugalPost-demographic dividendPre-demographic dividendPuerto RicoQatarRomaniaRussian FederationRwandaSamoaSan MarinoSao Tome and PrincipeSaudi ArabiaSenegalSerbiaSeychellesSierra LeoneSingaporeSlovak RepublicSloveniaSmall statesSolomon IslandsSomaliaSouth AfricaSouth AsiaSouth Asia (IDA & IBRD)South SudanSpainSri LankaSt. Kitts and NevisSt. LuciaSt. Vincent and the GrenadinesSub-Saharan Africa Sub-Saharan Africa (excluding high income)Sub-Saharan Africa (IDA & IBRD countries)SudanSurinameSwazilandSwedenSwitzerlandSyrian Arab RepublicTajikistanTanzaniaThailandTimor-LesteTogoTongaTrinidad and TobagoTunisiaTurkeyTurkmenistanTuvaluUgandaUkraineUnited Arab EmiratesUnited KingdomUnited StatesUpper middle incomeUruguayUzbekistanVanuatuVenezuela, RBVietnamVirgin Islands (U.S.)West Bank and GazaWorldYemen, Rep.ZambiaZimbabwe Timeline:
This timeline shows a graph from 1962 to 2016 of Chile. No data until 1961. Number of actual observations by date: 55.
Source name:
World Development Indicators
Source organization:
World Bank national accounts data, and OECD National Accounts data files.
Categories, topics:
Economy & Growth
Last updated:
apr 23, 2017
Indicators value changes by year
Maximum:
665.385
jan 1, 1975
At the date of observation
Value
Absolute change
Change from previous value
jan 1, 1962
7.475
+7.475
0.0%
jan 1, 1963
12.02
+4.545
60.81%
jan 1, 1964
43.946
+31.926
265.61%
jan 1, 1965
46.408
+2.462
5.6%
jan 1, 1966
41.161
-5.247
-11.31%
jan 1, 1967
28.489
-12.672
-30.79%
jan 1, 1968
25.172
-3.316
-11.64%
jan 1, 1969
33.821
+8.648
34.36%
jan 1, 1970
40.031
+6.21
18.36%
jan 1, 1971
40.694
+0.663
1.66%
jan 1, 1972
18.256
-22.438
-55.14%
jan 1, 1973
85.544
+67.288
368.59%
jan 1, 1974
414.007
+328.463
383.97%
jan 1, 1975
665.385
+251.378
60.72%
jan 1, 1976
334.645
-330.739
-49.71%
jan 1, 1977
250.61
-84.036
-25.11%
jan 1, 1978
105.791
-144.819
-57.79%
jan 1, 1979
57.664
-48.127
-45.49%
jan 1, 1980
45.729
-11.935
-20.7%
jan 1, 1981
28.764
-16.965
-37.1%
jan 1, 1982
13.042
-15.722
-54.66%
jan 1, 1983
8.531
-4.511
-34.59%
jan 1, 1984
30.658
+22.127
259.38%
jan 1, 1985
12.612
-18.046
-58.86%
jan 1, 1986
30.709
+18.097
143.49%
jan 1, 1987
22.099
-8.61
-28.04%
jan 1, 1988
25.831
+3.732
16.89%
jan 1, 1989
22.673
-3.158
-12.22%
jan 1, 1990
13.522
-9.151
-40.36%
jan 1, 1991
22.459
+8.937
66.1%
jan 1, 1992
22.435
-0.024
-0.11%
jan 1, 1993
12.893
-9.542
-42.53%
jan 1, 1994
11.75
-1.143
-8.86%
jan 1, 1995
13.731
+1.98
16.85%
jan 1, 1996
10.421
-3.31
-24.11%
jan 1, 1997
2.727
-7.693
-73.83%
jan 1, 1998
4.27
+1.543
56.56%
jan 1, 1999
1.926
-2.344
-54.89%
jan 1, 2000
2.432
+0.506
26.25%
jan 1, 2001
10.278
+7.847
322.68%
jan 1, 2002
3.843
-6.435
-62.61%
jan 1, 2003
4.218
+0.375
9.76%
jan 1, 2004
5.861
+1.643
38.95%
jan 1, 2005
7.478
+1.617
27.59%
jan 1, 2006
7.552
+0.075
1.0%
jan 1, 2007
12.81
+5.257
69.61%
jan 1, 2008
4.844
-7.966
-62.19%
jan 1, 2009
0.473
-4.371
-90.23%
jan 1, 2010
3.842
+3.369
712.27%
jan 1, 2011
8.83
+4.988
129.81%
jan 1, 2012
3.268
-5.562
-62.99%
jan 1, 2013
0.85
-2.418
-73.99%
jan 1, 2014
2.289
+1.439
169.3%
jan 1, 2015
5.553
+3.264
142.58%
jan 1, 2016
4.332
-1.221
-21.99%
Ranking of countries by current statistics by years


Comments: