29
/
en
AIzaSyAYiBZKx7MnpbEhh9jyipgxe19OcubqV5w
April 1, 2024
92708
Brunei Darussalam
BRN
true
2
1
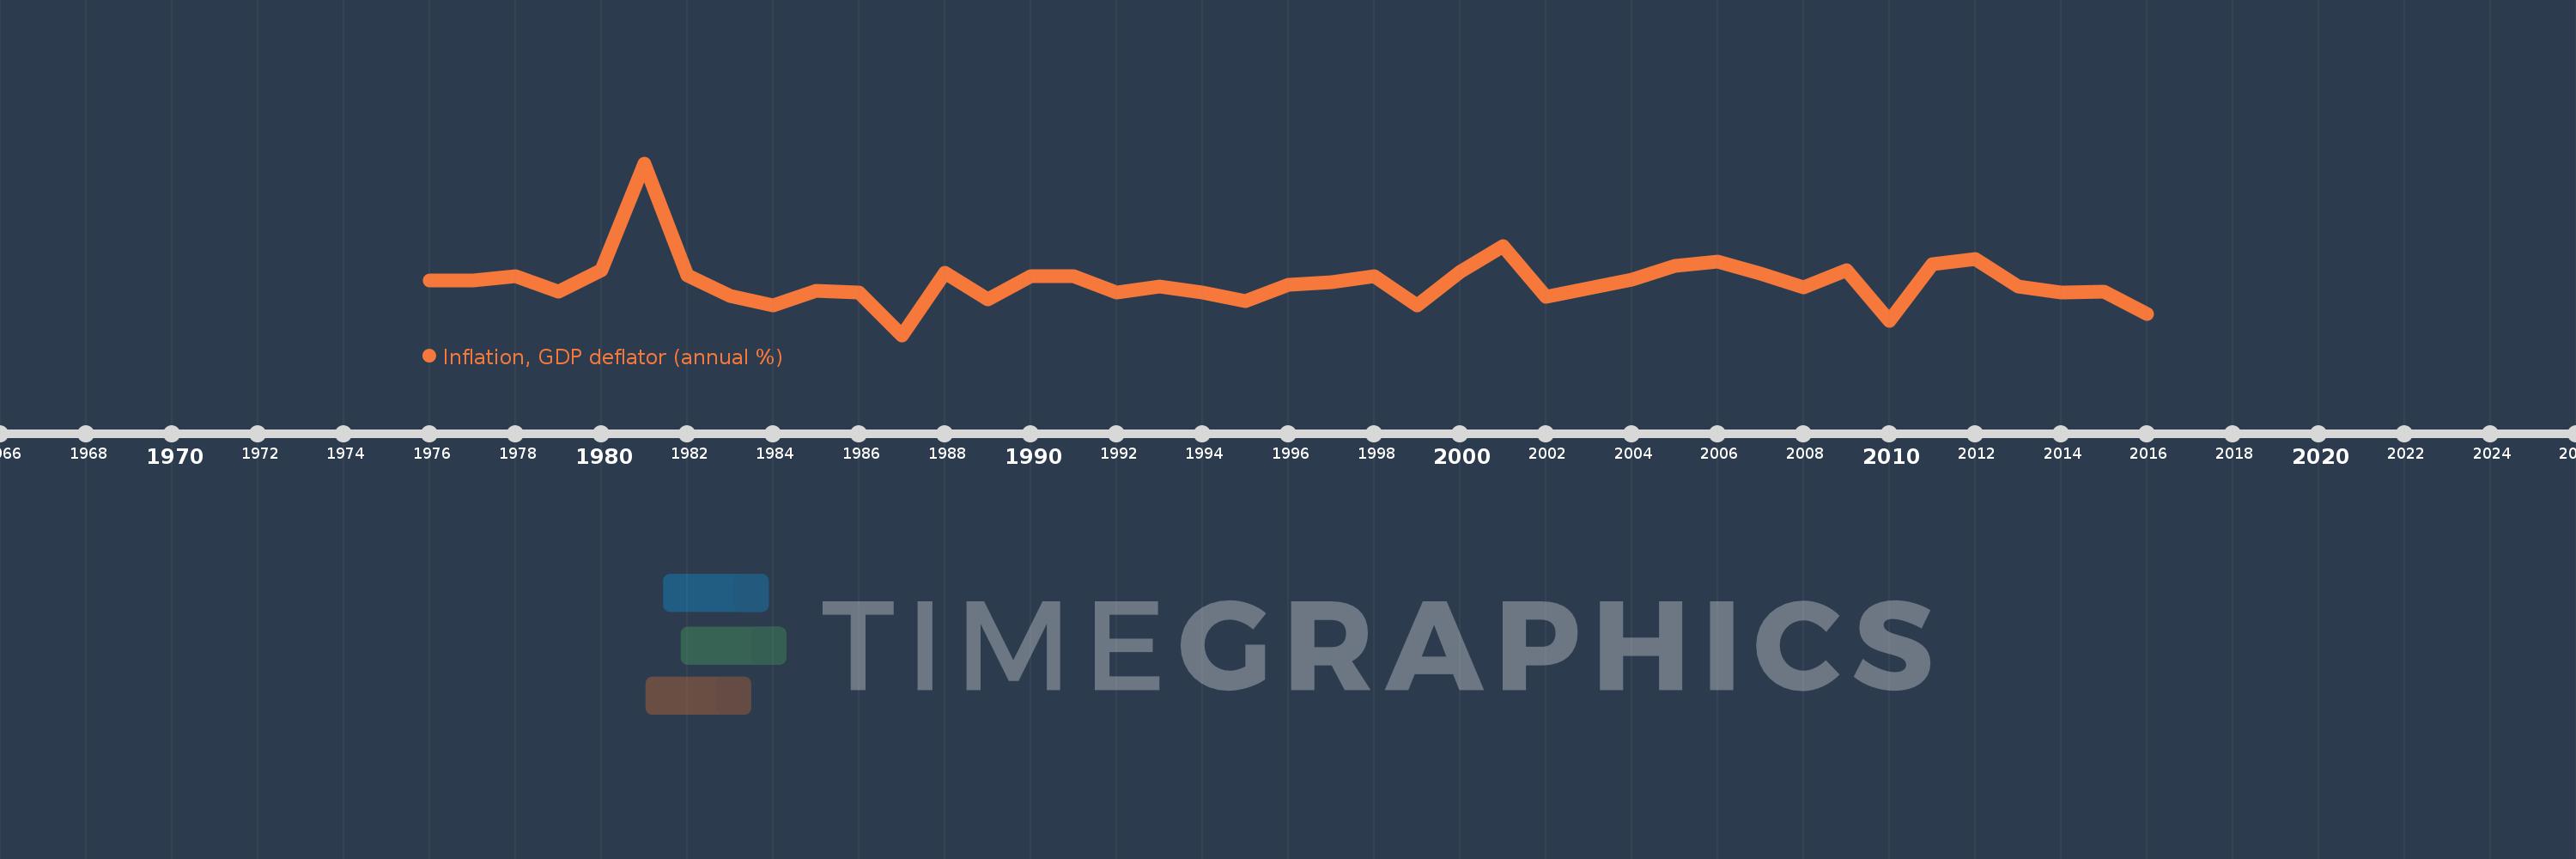
Inflation, GDP deflator (annual %)
2016,2015,2014,2013,2012,2011,2010,2009,2008,2007,2006,2005,2004,2003,2002,2001,2000,1999,1998,1997,1996,1995,1994,1993,1992,1991,1990,1989,1988,1987,1986,1985,1984,1983,1982,1981,1980,1979,1978,1977,1976
This statistics in other country:
AfghanistanAlbaniaAlgeriaAndorraAngolaAntigua and BarbudaArab WorldArgentinaArmeniaArubaAustraliaAustriaAzerbaijanBahamas, TheBahrainBangladeshBarbadosBelarusBelgiumBelizeBeninBermudaBhutanBoliviaBosnia and HerzegovinaBotswanaBrazilBrunei DarussalamBulgariaBurkina FasoBurundiCabo VerdeCambodiaCameroonCanadaCaribbean small statesCayman IslandsCentral African RepublicCentral Europe and the BalticsChadChannel IslandsChileChinaColombiaComorosCongo, Dem. Rep.Congo, Rep.Costa RicaCote d'IvoireCroatiaCubaCyprusCzech RepublicDenmarkDjiboutiDominicaDominican RepublicEarly-demographic dividendEast Asia & PacificEast Asia & Pacific (excluding high income)East Asia & Pacific (IDA & IBRD countries)EcuadorEgypt, Arab Rep.El SalvadorEquatorial GuineaEritreaEstoniaEthiopiaEuro areaEurope & Central AsiaEurope & Central Asia (excluding high income)Europe & Central Asia (IDA & IBRD countries)European UnionFijiFinlandFragile and conflict affected situationsFranceFrench PolynesiaGabonGambia, TheGeorgiaGermanyGhanaGreeceGreenlandGrenadaGuatemalaGuineaGuinea-BissauGuyanaHaitiHeavily indebted poor countries (HIPC)High incomeHondurasHong Kong SAR, ChinaHungaryIBRD onlyIcelandIDA & IBRD totalIDA blendIDA onlyIDA totalIndiaIndonesiaIran, Islamic Rep.IraqIrelandIsle of ManIsraelItalyJamaicaJapanJordanKazakhstanKenyaKiribatiKorea, Rep.KosovoKuwaitKyrgyz RepublicLao PDRLate-demographic dividendLatin America & Caribbean Latin America & Caribbean (excluding high income)Latin America & the Caribbean (IDA & IBRD countries)LatviaLeast developed countries: UN classificationLebanonLesothoLiberiaLibyaLiechtensteinLithuaniaLow & middle incomeLow incomeLower middle incomeLuxembourgMacao SAR, ChinaMacedonia, FYRMadagascarMalawiMalaysiaMaldivesMaliMaltaMarshall IslandsMauritaniaMauritiusMexicoMicronesia, Fed. Sts.Middle East & North AfricaMiddle East & North Africa (excluding high income)Middle East & North Africa (IDA & IBRD countries)Middle incomeMoldovaMonacoMongoliaMontenegroMoroccoMozambiqueMyanmarNamibiaNauruNepalNetherlandsNew CaledoniaNew ZealandNicaraguaNigerNigeriaNorth AmericaNorwayOECD membersOmanOther small statesPacific island small statesPakistanPalauPanamaPapua New GuineaParaguayPeruPhilippinesPolandPortugalPost-demographic dividendPre-demographic dividendPuerto RicoQatarRomaniaRussian FederationRwandaSamoaSan MarinoSao Tome and PrincipeSaudi ArabiaSenegalSerbiaSeychellesSierra LeoneSingaporeSlovak RepublicSloveniaSmall statesSolomon IslandsSomaliaSouth AfricaSouth AsiaSouth Asia (IDA & IBRD)South SudanSpainSri LankaSt. Kitts and NevisSt. LuciaSt. Vincent and the GrenadinesSub-Saharan Africa Sub-Saharan Africa (excluding high income)Sub-Saharan Africa (IDA & IBRD countries)SudanSurinameSwazilandSwedenSwitzerlandSyrian Arab RepublicTajikistanTanzaniaThailandTimor-LesteTogoTongaTrinidad and TobagoTunisiaTurkeyTurkmenistanTuvaluUgandaUkraineUnited Arab EmiratesUnited KingdomUnited StatesUpper middle incomeUruguayUzbekistanVanuatuVenezuela, RBVietnamVirgin Islands (U.S.)West Bank and GazaWorldYemen, Rep.ZambiaZimbabwe Timeline:
This timeline shows a graph from 1976 to 2016 of Brunei Darussalam. No data until 1975. Number of actual observations by date: 41.
Source name:
World Development Indicators
Source organization:
World Bank national accounts data, and OECD National Accounts data files.
Categories, topics:
Economy & Growth
Last updated:
apr 23, 2017
Indicators value changes by year
Minimum:
-31.905
jan 1, 1987
Maximum:
86.114
jan 1, 1981
At the date of observation
Value
Absolute change
Change from previous value
jan 1, 1976
5.519
+5.519
0.0%
jan 1, 1977
5.627
+0.108
1.96%
jan 1, 1978
8.381
+2.754
48.94%
jan 1, 1979
-2.171
-10.553
-125.91%
jan 1, 1980
12.672
+14.843
-683.57%
jan 1, 1981
86.114
+73.442
579.57%
jan 1, 1982
9.022
-77.092
-89.52%
jan 1, 1983
-4.838
-13.86
-153.63%
jan 1, 1984
-11.42
-6.582
136.03%
jan 1, 1985
-1.274
+10.146
-88.84%
jan 1, 1986
-2.465
-1.191
93.45%
jan 1, 1987
-31.905
-29.44
1.19K%
jan 1, 1988
10.73
+42.635
-133.63%
jan 1, 1989
-7.669
-18.399
-171.47%
jan 1, 1990
8.698
+16.367
-213.42%
jan 1, 1991
8.41
-0.288
-3.31%
jan 1, 1992
-2.837
-11.247
-133.74%
jan 1, 1993
1.727
+4.564
-160.86%
jan 1, 1994
-2.951
-4.678
-270.92%
jan 1, 1995
-8.764
-5.812
196.92%
jan 1, 1996
2.873
+11.637
-132.78%
jan 1, 1997
4.489
+1.616
56.24%
jan 1, 1998
8.585
+4.096
91.25%
jan 1, 1999
-11.649
-20.233
-235.69%
jan 1, 2000
11.594
+23.243
-199.53%
jan 1, 2001
29.016
+17.422
150.27%
jan 1, 2002
-5.592
-34.608
-119.27%
jan 1, 2003
0.374
+5.966
-106.69%
jan 1, 2004
6.105
+5.73
1.53K%
jan 1, 2005
15.886
+9.782
160.23%
jan 1, 2006
18.766
+2.88
18.13%
jan 1, 2007
10.048
-8.719
-46.46%
jan 1, 2008
1.12
-8.927
-88.85%
jan 1, 2009
12.693
+11.572
1.03K%
jan 1, 2010
-22.091
-34.784
-274.05%
jan 1, 2011
16.688
+38.78
-175.54%
jan 1, 2012
20.181
+3.492
20.93%
jan 1, 2013
1.222
-18.959
-93.95%
jan 1, 2014
-2.824
-4.046
-331.17%
jan 1, 2015
-1.864
+0.96
-34.0%
jan 1, 2016
-17.588
-15.724
843.63%
Ranking of countries by current statistics by years


Comments: