29
/
en
AIzaSyAYiBZKx7MnpbEhh9jyipgxe19OcubqV5w
April 1, 2024
56319
Small states
SST
false
2
1
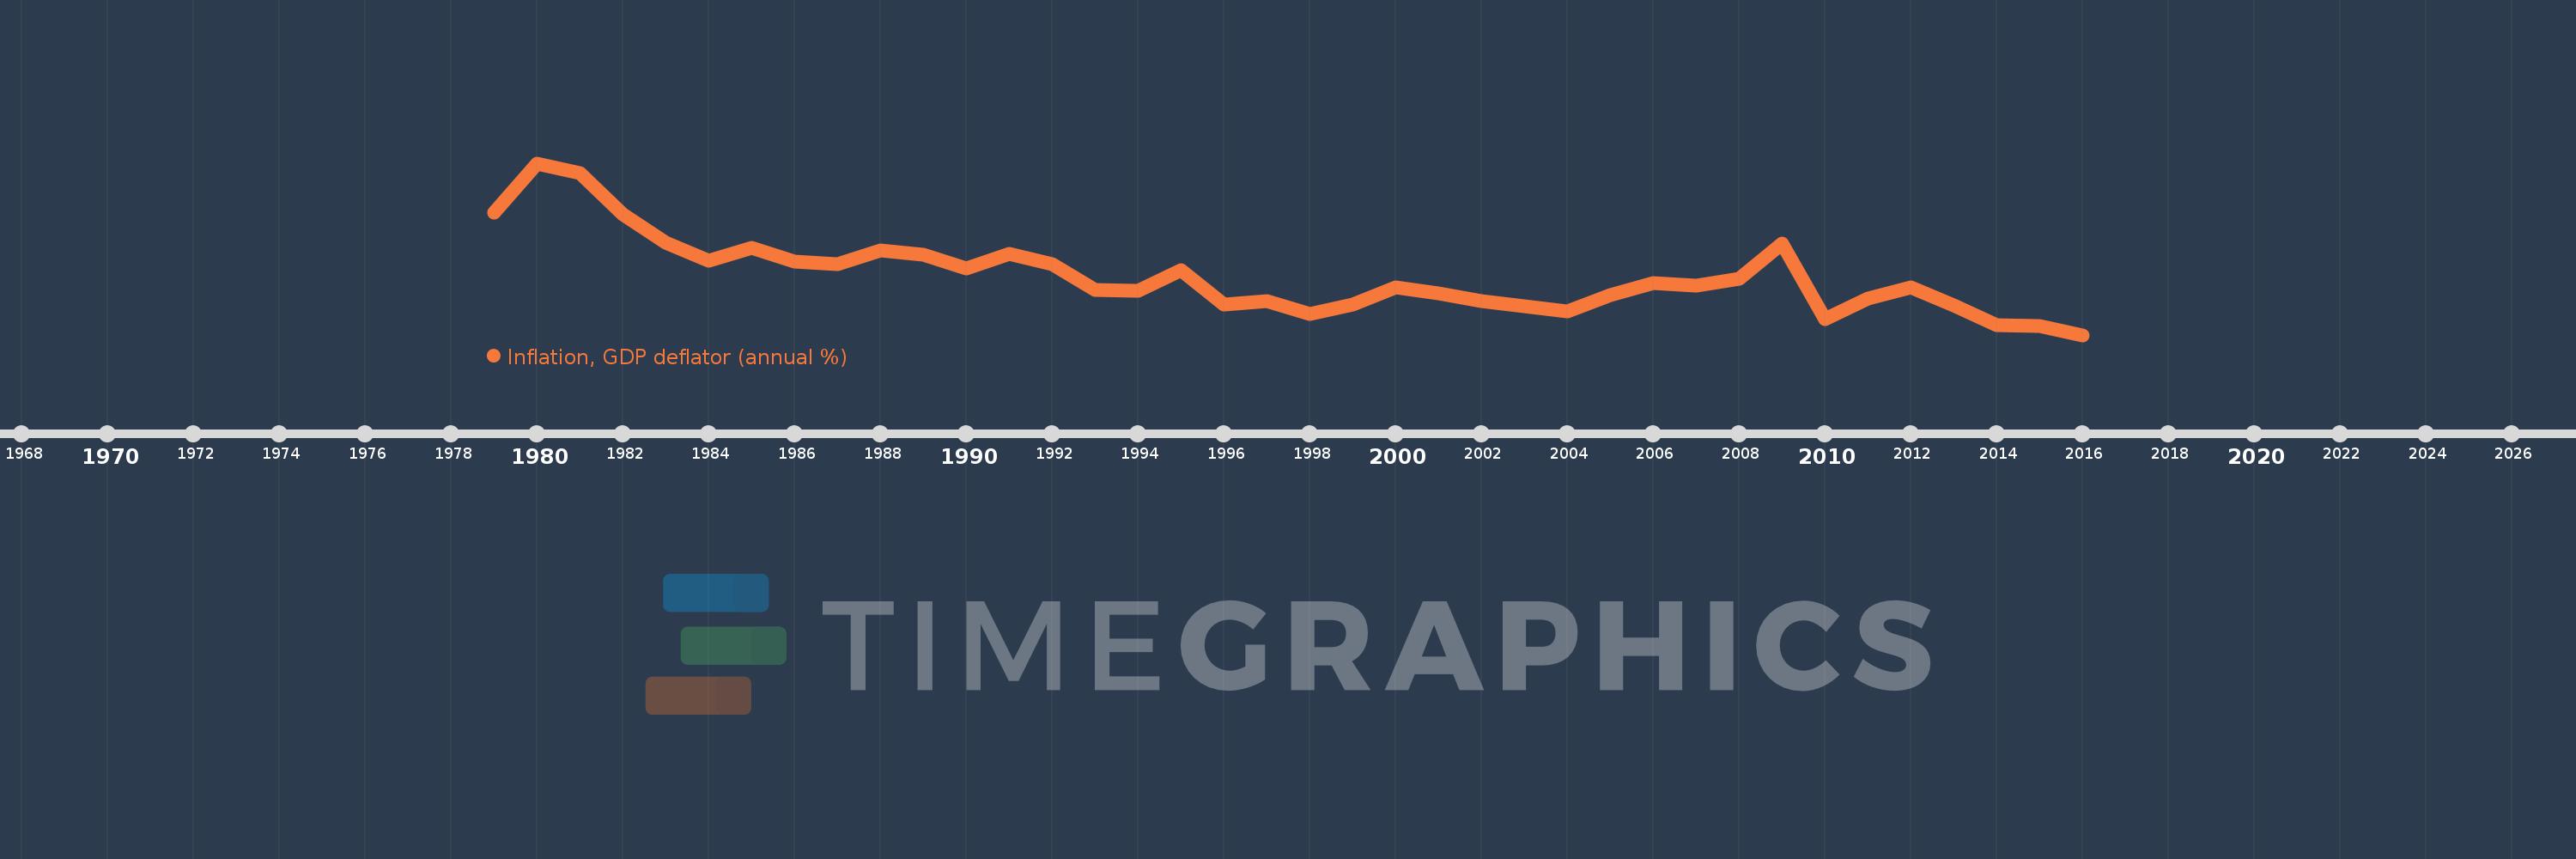
Inflation, GDP deflator (annual %)
2016,2015,2014,2013,2012,2011,2010,2009,2008,2007,2006,2005,2004,2003,2002,2001,2000,1999,1998,1997,1996,1995,1994,1993,1992,1991,1990,1989,1988,1987,1986,1985,1984,1983,1982,1981,1980,1979
This statistics in other country:
AfghanistanAlbaniaAlgeriaAndorraAngolaAntigua and BarbudaArab WorldArgentinaArmeniaArubaAustraliaAustriaAzerbaijanBahamas, TheBahrainBangladeshBarbadosBelarusBelgiumBelizeBeninBermudaBhutanBoliviaBosnia and HerzegovinaBotswanaBrazilBrunei DarussalamBulgariaBurkina FasoBurundiCabo VerdeCambodiaCameroonCanadaCaribbean small statesCayman IslandsCentral African RepublicCentral Europe and the BalticsChadChannel IslandsChileChinaColombiaComorosCongo, Dem. Rep.Congo, Rep.Costa RicaCote d'IvoireCroatiaCubaCyprusCzech RepublicDenmarkDjiboutiDominicaDominican RepublicEarly-demographic dividendEast Asia & PacificEast Asia & Pacific (excluding high income)East Asia & Pacific (IDA & IBRD countries)EcuadorEgypt, Arab Rep.El SalvadorEquatorial GuineaEritreaEstoniaEthiopiaEuro areaEurope & Central AsiaEurope & Central Asia (excluding high income)Europe & Central Asia (IDA & IBRD countries)European UnionFijiFinlandFragile and conflict affected situationsFranceFrench PolynesiaGabonGambia, TheGeorgiaGermanyGhanaGreeceGreenlandGrenadaGuatemalaGuineaGuinea-BissauGuyanaHaitiHeavily indebted poor countries (HIPC)High incomeHondurasHong Kong SAR, ChinaHungaryIBRD onlyIcelandIDA & IBRD totalIDA blendIDA onlyIDA totalIndiaIndonesiaIran, Islamic Rep.IraqIrelandIsle of ManIsraelItalyJamaicaJapanJordanKazakhstanKenyaKiribatiKorea, Rep.KosovoKuwaitKyrgyz RepublicLao PDRLate-demographic dividendLatin America & Caribbean Latin America & Caribbean (excluding high income)Latin America & the Caribbean (IDA & IBRD countries)LatviaLeast developed countries: UN classificationLebanonLesothoLiberiaLibyaLiechtensteinLithuaniaLow & middle incomeLow incomeLower middle incomeLuxembourgMacao SAR, ChinaMacedonia, FYRMadagascarMalawiMalaysiaMaldivesMaliMaltaMarshall IslandsMauritaniaMauritiusMexicoMicronesia, Fed. Sts.Middle East & North AfricaMiddle East & North Africa (excluding high income)Middle East & North Africa (IDA & IBRD countries)Middle incomeMoldovaMonacoMongoliaMontenegroMoroccoMozambiqueMyanmarNamibiaNauruNepalNetherlandsNew CaledoniaNew ZealandNicaraguaNigerNigeriaNorth AmericaNorwayOECD membersOmanOther small statesPacific island small statesPakistanPalauPanamaPapua New GuineaParaguayPeruPhilippinesPolandPortugalPost-demographic dividendPre-demographic dividendPuerto RicoQatarRomaniaRussian FederationRwandaSamoaSan MarinoSao Tome and PrincipeSaudi ArabiaSenegalSerbiaSeychellesSierra LeoneSingaporeSlovak RepublicSloveniaSmall statesSolomon IslandsSomaliaSouth AfricaSouth AsiaSouth Asia (IDA & IBRD)South SudanSpainSri LankaSt. Kitts and NevisSt. LuciaSt. Vincent and the GrenadinesSub-Saharan Africa Sub-Saharan Africa (excluding high income)Sub-Saharan Africa (IDA & IBRD countries)SudanSurinameSwazilandSwedenSwitzerlandSyrian Arab RepublicTajikistanTanzaniaThailandTimor-LesteTogoTongaTrinidad and TobagoTunisiaTurkeyTurkmenistanTuvaluUgandaUkraineUnited Arab EmiratesUnited KingdomUnited StatesUpper middle incomeUruguayUzbekistanVanuatuVenezuela, RBVietnamVirgin Islands (U.S.)West Bank and GazaWorldYemen, Rep.ZambiaZimbabwe Timeline:
This timeline shows a graph from 1979 to 2016 of Small states. No data until 1978. Number of actual observations by date: 38.
Source name:
World Development Indicators
Source organization:
World Bank national accounts data, and OECD National Accounts data files.
Categories, topics:
Economy & Growth
Last updated:
apr 23, 2017
Indicators value changes by year
Maximum:
13.081
jan 1, 1980
At the date of observation
Value
Absolute change
Change from previous value
jan 1, 1979
9.592
+9.592
0.0%
jan 1, 1980
13.081
+3.489
36.37%
jan 1, 1981
12.393
-0.688
-5.26%
jan 1, 1982
9.502
-2.89
-23.32%
jan 1, 1983
7.466
-2.036
-21.43%
jan 1, 1984
6.239
-1.227
-16.43%
jan 1, 1985
7.102
+0.862
13.82%
jan 1, 1986
6.15
-0.952
-13.4%
jan 1, 1987
5.976
-0.174
-2.83%
jan 1, 1988
6.962
+0.987
16.51%
jan 1, 1989
6.65
-0.312
-4.48%
jan 1, 1990
5.706
-0.945
-14.2%
jan 1, 1991
6.679
+0.974
17.06%
jan 1, 1992
5.996
-0.683
-10.23%
jan 1, 1993
4.177
-1.819
-30.34%
jan 1, 1994
4.102
-0.075
-1.8%
jan 1, 1995
5.562
+1.46
35.6%
jan 1, 1996
3.127
-2.435
-43.78%
jan 1, 1997
3.356
+0.229
7.33%
jan 1, 1998
2.502
-0.854
-25.44%
jan 1, 1999
3.162
+0.66
26.39%
jan 1, 2000
4.375
+1.213
38.35%
jan 1, 2001
3.922
-0.453
-10.35%
jan 1, 2002
3.361
-0.561
-14.31%
jan 1, 2003
3.009
-0.352
-10.47%
jan 1, 2004
2.639
-0.37
-12.29%
jan 1, 2005
3.791
+1.152
43.63%
jan 1, 2006
4.656
+0.865
22.81%
jan 1, 2007
4.489
-0.167
-3.58%
jan 1, 2008
4.929
+0.44
9.81%
jan 1, 2009
7.408
+2.479
50.28%
jan 1, 2010
2.13
-5.278
-71.24%
jan 1, 2011
3.564
+1.434
67.32%
jan 1, 2012
4.373
+0.809
22.69%
jan 1, 2013
3.097
-1.276
-29.19%
jan 1, 2014
1.719
-1.378
-44.5%
jan 1, 2015
1.657
-0.062
-3.6%
jan 1, 2016
1.0
-0.657
-39.66%
Ranking of countries by current statistics by years


Comments: