29
/
en
AIzaSyAYiBZKx7MnpbEhh9jyipgxe19OcubqV5w
April 1, 2024
37457
IDA & IBRD total
IBT
false
2
1
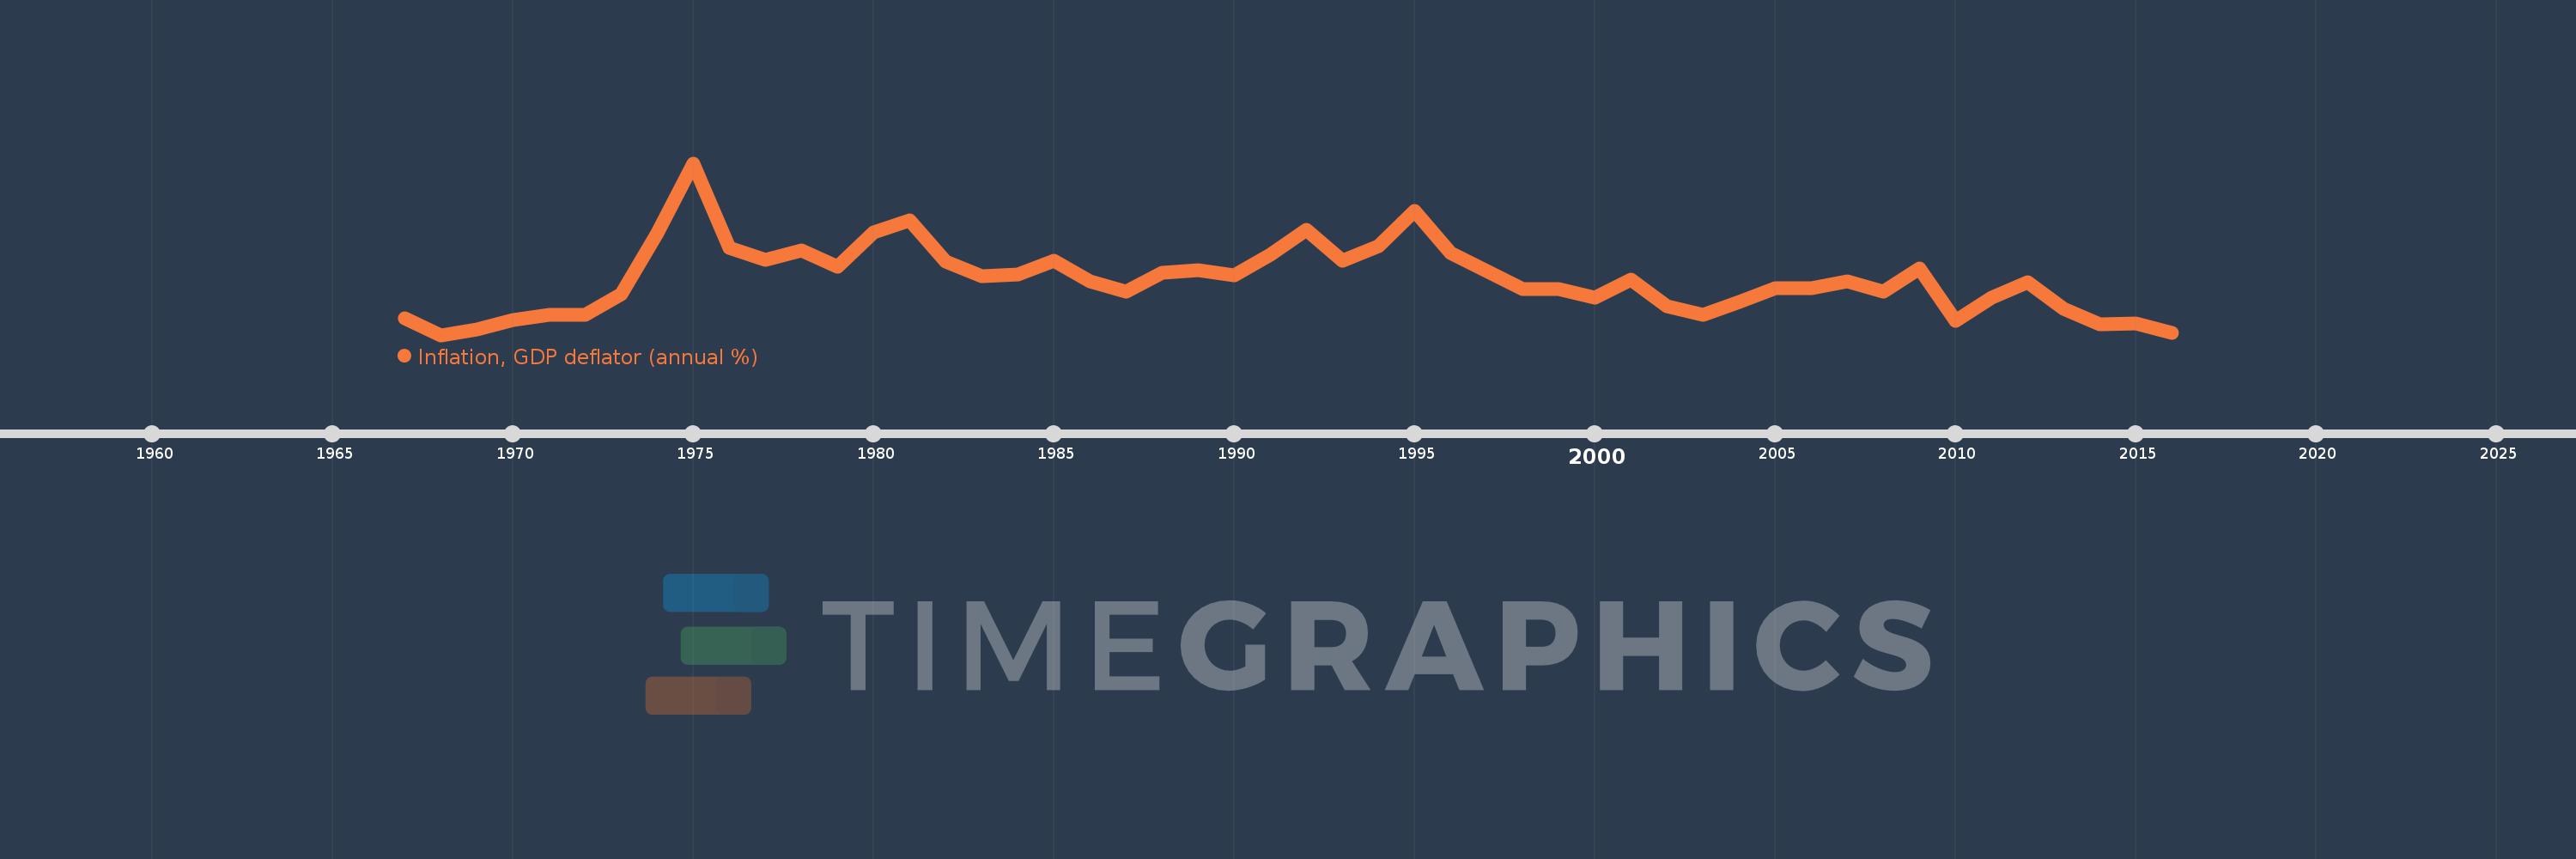
Inflation, GDP deflator (annual %)
2016,2015,2014,2013,2012,2011,2010,2009,2008,2007,2006,2005,2004,2003,2002,2001,2000,1999,1998,1997,1996,1995,1994,1993,1992,1991,1990,1989,1988,1987,1986,1985,1984,1983,1982,1981,1980,1979,1978,1977,1976,1975,1974,1973,1972,1971,1970,1969,1968,1967
This statistics in other country:
AfghanistanAlbaniaAlgeriaAndorraAngolaAntigua and BarbudaArab WorldArgentinaArmeniaArubaAustraliaAustriaAzerbaijanBahamas, TheBahrainBangladeshBarbadosBelarusBelgiumBelizeBeninBermudaBhutanBoliviaBosnia and HerzegovinaBotswanaBrazilBrunei DarussalamBulgariaBurkina FasoBurundiCabo VerdeCambodiaCameroonCanadaCaribbean small statesCayman IslandsCentral African RepublicCentral Europe and the BalticsChadChannel IslandsChileChinaColombiaComorosCongo, Dem. Rep.Congo, Rep.Costa RicaCote d'IvoireCroatiaCubaCyprusCzech RepublicDenmarkDjiboutiDominicaDominican RepublicEarly-demographic dividendEast Asia & PacificEast Asia & Pacific (excluding high income)East Asia & Pacific (IDA & IBRD countries)EcuadorEgypt, Arab Rep.El SalvadorEquatorial GuineaEritreaEstoniaEthiopiaEuro areaEurope & Central AsiaEurope & Central Asia (excluding high income)Europe & Central Asia (IDA & IBRD countries)European UnionFijiFinlandFragile and conflict affected situationsFranceFrench PolynesiaGabonGambia, TheGeorgiaGermanyGhanaGreeceGreenlandGrenadaGuatemalaGuineaGuinea-BissauGuyanaHaitiHeavily indebted poor countries (HIPC)High incomeHondurasHong Kong SAR, ChinaHungaryIBRD onlyIcelandIDA & IBRD totalIDA blendIDA onlyIDA totalIndiaIndonesiaIran, Islamic Rep.IraqIrelandIsle of ManIsraelItalyJamaicaJapanJordanKazakhstanKenyaKiribatiKorea, Rep.KosovoKuwaitKyrgyz RepublicLao PDRLate-demographic dividendLatin America & Caribbean Latin America & Caribbean (excluding high income)Latin America & the Caribbean (IDA & IBRD countries)LatviaLeast developed countries: UN classificationLebanonLesothoLiberiaLibyaLiechtensteinLithuaniaLow & middle incomeLow incomeLower middle incomeLuxembourgMacao SAR, ChinaMacedonia, FYRMadagascarMalawiMalaysiaMaldivesMaliMaltaMarshall IslandsMauritaniaMauritiusMexicoMicronesia, Fed. Sts.Middle East & North AfricaMiddle East & North Africa (excluding high income)Middle East & North Africa (IDA & IBRD countries)Middle incomeMoldovaMonacoMongoliaMontenegroMoroccoMozambiqueMyanmarNamibiaNauruNepalNetherlandsNew CaledoniaNew ZealandNicaraguaNigerNigeriaNorth AmericaNorwayOECD membersOmanOther small statesPacific island small statesPakistanPalauPanamaPapua New GuineaParaguayPeruPhilippinesPolandPortugalPost-demographic dividendPre-demographic dividendPuerto RicoQatarRomaniaRussian FederationRwandaSamoaSan MarinoSao Tome and PrincipeSaudi ArabiaSenegalSerbiaSeychellesSierra LeoneSingaporeSlovak RepublicSloveniaSmall statesSolomon IslandsSomaliaSouth AfricaSouth AsiaSouth Asia (IDA & IBRD)South SudanSpainSri LankaSt. Kitts and NevisSt. LuciaSt. Vincent and the GrenadinesSub-Saharan Africa Sub-Saharan Africa (excluding high income)Sub-Saharan Africa (IDA & IBRD countries)SudanSurinameSwazilandSwedenSwitzerlandSyrian Arab RepublicTajikistanTanzaniaThailandTimor-LesteTogoTongaTrinidad and TobagoTunisiaTurkeyTurkmenistanTuvaluUgandaUkraineUnited Arab EmiratesUnited KingdomUnited StatesUpper middle incomeUruguayUzbekistanVanuatuVenezuela, RBVietnamVirgin Islands (U.S.)West Bank and GazaWorldYemen, Rep.ZambiaZimbabwe Timeline:
This timeline shows a graph from 1967 to 2016 of IDA & IBRD total. No data until 1966. Number of actual observations by date: 50.
Source name:
World Development Indicators
Source organization:
World Bank national accounts data, and OECD National Accounts data files.
Categories, topics:
Economy & Growth
Last updated:
apr 23, 2017
Indicators value changes by year
At the date of observation
Value
Absolute change
Change from previous value
jan 1, 1967
3.806
+3.806
0.0%
jan 1, 1968
1.963
-1.842
-48.41%
jan 1, 1969
2.575
+0.612
31.16%
jan 1, 1970
3.562
+0.987
38.34%
jan 1, 1971
4.187
+0.625
17.55%
jan 1, 1972
4.144
-0.043
-1.03%
jan 1, 1973
6.35
+2.206
53.22%
jan 1, 1974
12.988
+6.638
104.54%
jan 1, 1975
20.58
+7.592
58.45%
jan 1, 1976
11.41
-9.17
-44.56%
jan 1, 1977
10.083
-1.327
-11.63%
jan 1, 1978
11.169
+1.085
10.76%
jan 1, 1979
9.332
-1.837
-16.45%
jan 1, 1980
13.048
+3.717
39.83%
jan 1, 1981
14.376
+1.327
10.17%
jan 1, 1982
9.926
-4.45
-30.96%
jan 1, 1983
8.315
-1.611
-16.23%
jan 1, 1984
8.488
+0.173
2.08%
jan 1, 1985
10.042
+1.554
18.31%
jan 1, 1986
7.737
-2.305
-22.95%
jan 1, 1987
6.685
-1.052
-13.6%
jan 1, 1988
8.684
+1.999
29.91%
jan 1, 1989
8.958
+0.274
3.15%
jan 1, 1990
8.437
-0.521
-5.82%
jan 1, 1991
10.665
+2.228
26.41%
jan 1, 1992
13.407
+2.742
25.71%
jan 1, 1993
10.057
-3.35
-24.98%
jan 1, 1994
11.593
+1.536
15.28%
jan 1, 1995
15.448
+3.855
33.25%
jan 1, 1996
10.817
-4.631
-29.98%
jan 1, 1997
8.854
-1.963
-18.15%
jan 1, 1998
6.945
-1.908
-21.56%
jan 1, 1999
6.934
-0.011
-0.16%
jan 1, 2000
5.992
-0.942
-13.59%
jan 1, 2001
7.99
+1.998
33.34%
jan 1, 2002
5.073
-2.917
-36.5%
jan 1, 2003
4.166
-0.907
-17.87%
jan 1, 2004
5.539
+1.373
32.95%
jan 1, 2005
7.022
+1.483
26.77%
jan 1, 2006
7.026
+0.004
0.06%
jan 1, 2007
7.79
+0.763
10.86%
jan 1, 2008
6.651
-1.139
-14.62%
jan 1, 2009
9.162
+2.511
37.76%
jan 1, 2010
3.518
-5.644
-61.61%
jan 1, 2011
6.043
+2.525
71.79%
jan 1, 2012
7.654
+1.611
26.67%
jan 1, 2013
4.832
-2.822
-36.87%
jan 1, 2014
3.135
-1.697
-35.12%
jan 1, 2015
3.26
+0.125
3.99%
jan 1, 2016
2.162
-1.098
-33.69%
Ranking of countries by current statistics by years


Comments: