29
/
en
AIzaSyAYiBZKx7MnpbEhh9jyipgxe19OcubqV5w
April 1, 2024
248871
Sri Lanka
LKA
true
2
1
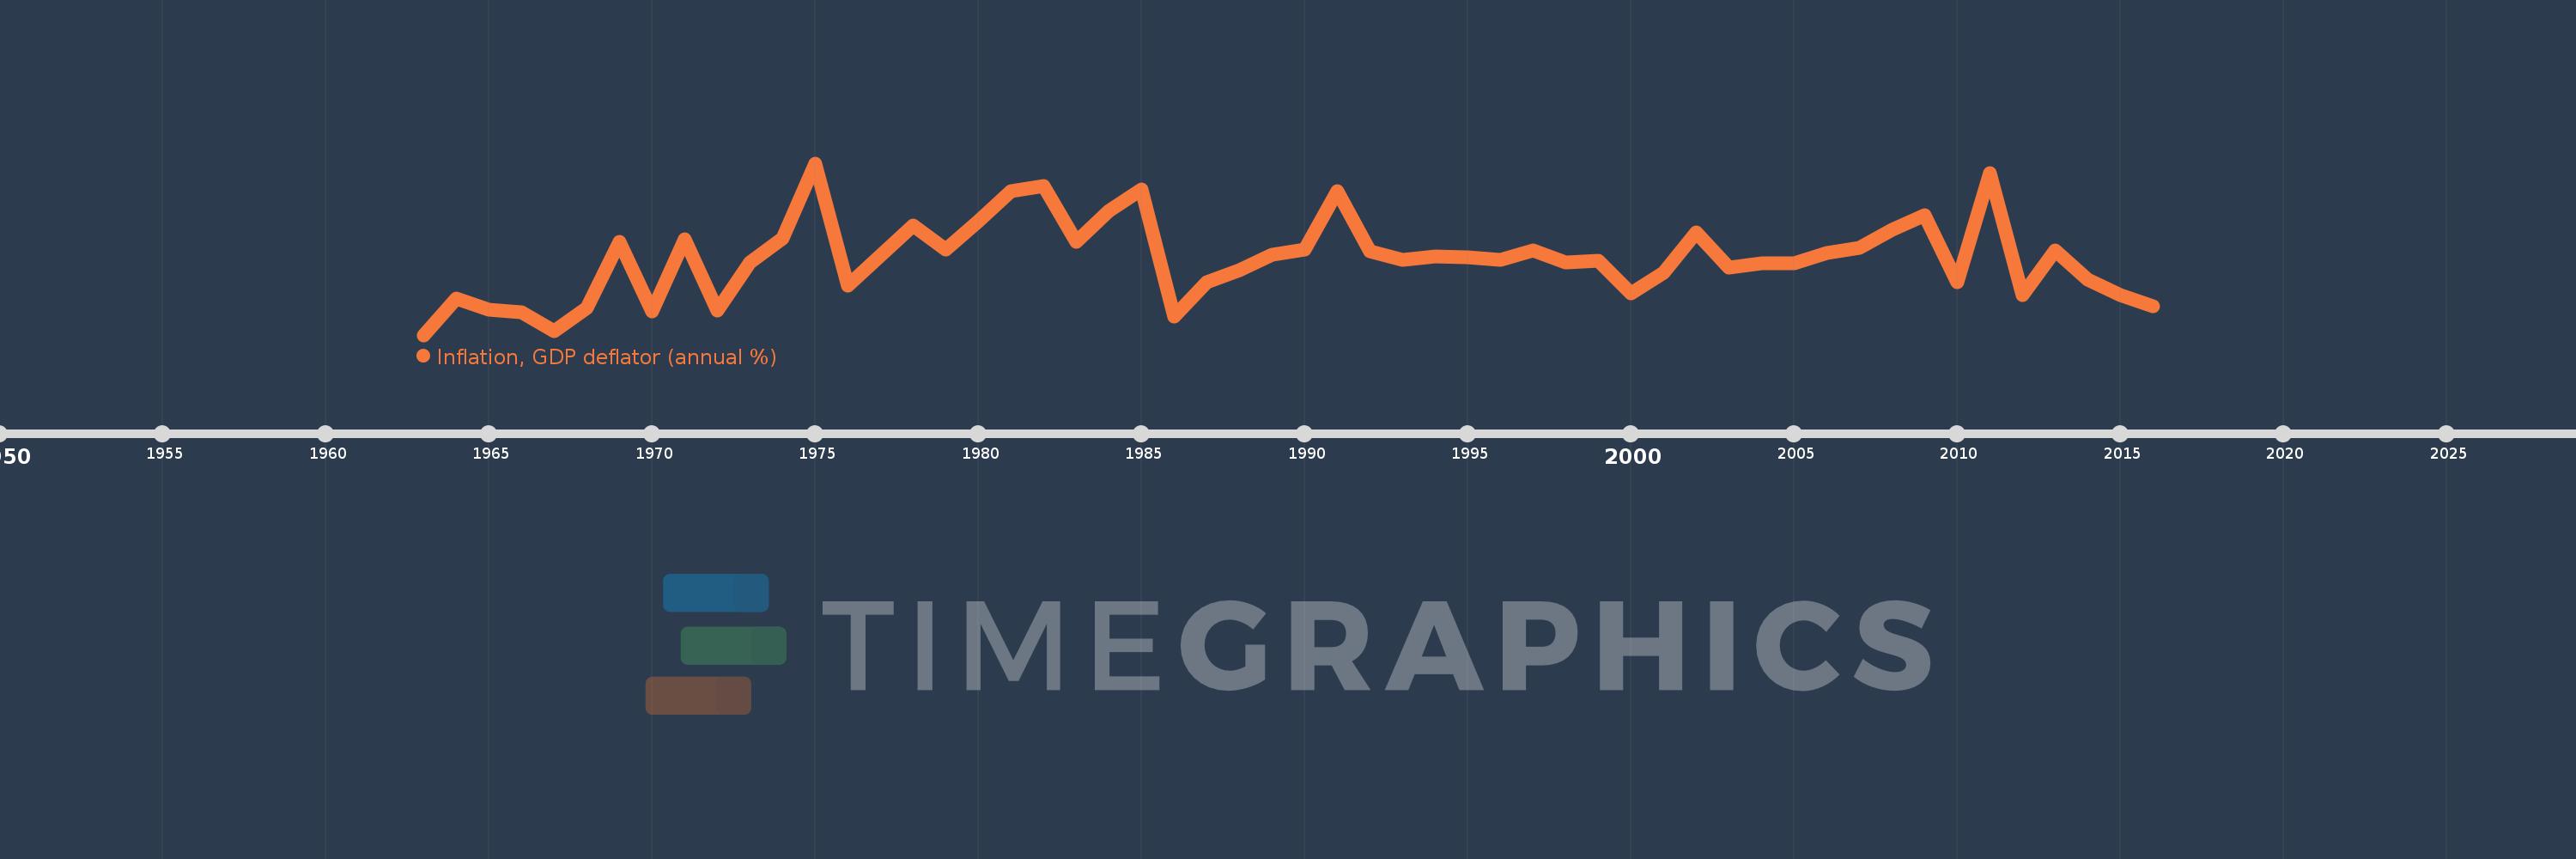
Inflation, GDP deflator (annual %)
2016,2015,2014,2013,2012,2011,2010,2009,2008,2007,2006,2005,2004,2003,2002,2001,2000,1999,1998,1997,1996,1995,1994,1993,1992,1991,1990,1989,1988,1987,1986,1985,1984,1983,1982,1981,1980,1979,1978,1977,1976,1975,1974,1973,1972,1971,1970,1969,1968,1967,1966,1965,1964,1963
This statistics in other country:
AfghanistanAlbaniaAlgeriaAndorraAngolaAntigua and BarbudaArab WorldArgentinaArmeniaArubaAustraliaAustriaAzerbaijanBahamas, TheBahrainBangladeshBarbadosBelarusBelgiumBelizeBeninBermudaBhutanBoliviaBosnia and HerzegovinaBotswanaBrazilBrunei DarussalamBulgariaBurkina FasoBurundiCabo VerdeCambodiaCameroonCanadaCaribbean small statesCayman IslandsCentral African RepublicCentral Europe and the BalticsChadChannel IslandsChileChinaColombiaComorosCongo, Dem. Rep.Congo, Rep.Costa RicaCote d'IvoireCroatiaCubaCyprusCzech RepublicDenmarkDjiboutiDominicaDominican RepublicEarly-demographic dividendEast Asia & PacificEast Asia & Pacific (excluding high income)East Asia & Pacific (IDA & IBRD countries)EcuadorEgypt, Arab Rep.El SalvadorEquatorial GuineaEritreaEstoniaEthiopiaEuro areaEurope & Central AsiaEurope & Central Asia (excluding high income)Europe & Central Asia (IDA & IBRD countries)European UnionFijiFinlandFragile and conflict affected situationsFranceFrench PolynesiaGabonGambia, TheGeorgiaGermanyGhanaGreeceGreenlandGrenadaGuatemalaGuineaGuinea-BissauGuyanaHaitiHeavily indebted poor countries (HIPC)High incomeHondurasHong Kong SAR, ChinaHungaryIBRD onlyIcelandIDA & IBRD totalIDA blendIDA onlyIDA totalIndiaIndonesiaIran, Islamic Rep.IraqIrelandIsle of ManIsraelItalyJamaicaJapanJordanKazakhstanKenyaKiribatiKorea, Rep.KosovoKuwaitKyrgyz RepublicLao PDRLate-demographic dividendLatin America & Caribbean Latin America & Caribbean (excluding high income)Latin America & the Caribbean (IDA & IBRD countries)LatviaLeast developed countries: UN classificationLebanonLesothoLiberiaLibyaLiechtensteinLithuaniaLow & middle incomeLow incomeLower middle incomeLuxembourgMacao SAR, ChinaMacedonia, FYRMadagascarMalawiMalaysiaMaldivesMaliMaltaMarshall IslandsMauritaniaMauritiusMexicoMicronesia, Fed. Sts.Middle East & North AfricaMiddle East & North Africa (excluding high income)Middle East & North Africa (IDA & IBRD countries)Middle incomeMoldovaMonacoMongoliaMontenegroMoroccoMozambiqueMyanmarNamibiaNauruNepalNetherlandsNew CaledoniaNew ZealandNicaraguaNigerNigeriaNorth AmericaNorwayOECD membersOmanOther small statesPacific island small statesPakistanPalauPanamaPapua New GuineaParaguayPeruPhilippinesPolandPortugalPost-demographic dividendPre-demographic dividendPuerto RicoQatarRomaniaRussian FederationRwandaSamoaSan MarinoSao Tome and PrincipeSaudi ArabiaSenegalSerbiaSeychellesSierra LeoneSingaporeSlovak RepublicSloveniaSmall statesSolomon IslandsSomaliaSouth AfricaSouth AsiaSouth Asia (IDA & IBRD)South SudanSpainSri LankaSt. Kitts and NevisSt. LuciaSt. Vincent and the GrenadinesSub-Saharan Africa Sub-Saharan Africa (excluding high income)Sub-Saharan Africa (IDA & IBRD countries)SudanSurinameSwazilandSwedenSwitzerlandSyrian Arab RepublicTajikistanTanzaniaThailandTimor-LesteTogoTongaTrinidad and TobagoTunisiaTurkeyTurkmenistanTuvaluUgandaUkraineUnited Arab EmiratesUnited KingdomUnited StatesUpper middle incomeUruguayUzbekistanVanuatuVenezuela, RBVietnamVirgin Islands (U.S.)West Bank and GazaWorldYemen, Rep.ZambiaZimbabwe Timeline:
This timeline shows a graph from 1963 to 2016 of Sri Lanka. No data until 1962. Number of actual observations by date: 54.
Source name:
World Development Indicators
Source organization:
World Bank national accounts data, and OECD National Accounts data files.
Categories, topics:
Economy & Growth
Last updated:
apr 23, 2017
Indicators value changes by year
Minimum:
-2.347
jan 1, 1963
Maximum:
24.379
jan 1, 1975
At the date of observation
Value
Absolute change
Change from previous value
jan 1, 1963
-2.347
-2.347
0.0%
jan 1, 1964
3.311
+5.658
-241.1%
jan 1, 1965
1.599
-1.712
-51.71%
jan 1, 1966
1.168
-0.431
-26.97%
jan 1, 1967
-1.804
-2.971
-254.47%
jan 1, 1968
1.839
+3.642
-201.96%
jan 1, 1969
12.098
+10.259
557.92%
jan 1, 1970
1.298
-10.8
-89.27%
jan 1, 1971
12.508
+11.21
863.31%
jan 1, 1972
1.498
-11.01
-88.02%
jan 1, 1973
8.967
+7.468
498.41%
jan 1, 1974
12.749
+3.782
42.17%
jan 1, 1975
24.379
+11.63
91.23%
jan 1, 1976
5.35
-19.028
-78.05%
jan 1, 1977
9.976
+4.625
86.45%
jan 1, 1978
14.691
+4.716
47.27%
jan 1, 1979
10.918
-3.773
-25.68%
jan 1, 1980
15.397
+4.479
41.03%
jan 1, 1981
19.978
+4.58
29.75%
jan 1, 1982
20.885
+0.908
4.54%
jan 1, 1983
12.101
-8.784
-42.06%
jan 1, 1984
16.907
+4.806
39.71%
jan 1, 1985
20.301
+3.394
20.07%
jan 1, 1986
0.584
-19.717
-97.12%
jan 1, 1987
5.917
+5.333
913.4%
jan 1, 1988
7.751
+1.834
31.0%
jan 1, 1989
10.117
+2.366
30.52%
jan 1, 1990
10.923
+0.806
7.97%
jan 1, 1991
20.063
+9.14
83.68%
jan 1, 1992
10.624
-9.439
-47.05%
jan 1, 1993
9.404
-1.22
-11.49%
jan 1, 1994
9.884
+0.481
5.11%
jan 1, 1995
9.771
-0.114
-1.15%
jan 1, 1996
9.303
-0.467
-4.78%
jan 1, 1997
10.817
+1.514
16.27%
jan 1, 1998
8.924
-1.893
-17.5%
jan 1, 1999
9.214
+0.29
3.25%
jan 1, 2000
4.163
-5.051
-54.82%
jan 1, 2001
7.277
+3.115
74.82%
jan 1, 2002
13.665
+6.387
87.77%
jan 1, 2003
8.112
-5.553
-40.64%
jan 1, 2004
8.749
+0.637
7.85%
jan 1, 2005
8.801
+0.053
0.6%
jan 1, 2006
10.419
+1.617
18.37%
jan 1, 2007
11.277
+0.858
8.24%
jan 1, 2008
14.028
+2.751
24.4%
jan 1, 2009
16.327
+2.299
16.39%
jan 1, 2010
5.88
-10.447
-63.99%
jan 1, 2011
22.799
+16.919
287.75%
jan 1, 2012
3.831
-18.968
-83.2%
jan 1, 2013
10.828
+6.997
182.62%
jan 1, 2014
6.237
-4.591
-42.4%
jan 1, 2015
3.861
-2.376
-38.1%
jan 1, 2016
2.143
-1.717
-44.48%
Ranking of countries by current statistics by years


Comments: