29
/
en
AIzaSyAYiBZKx7MnpbEhh9jyipgxe19OcubqV5w
April 1, 2024
45192
Low & middle income
LMY
false
2
1
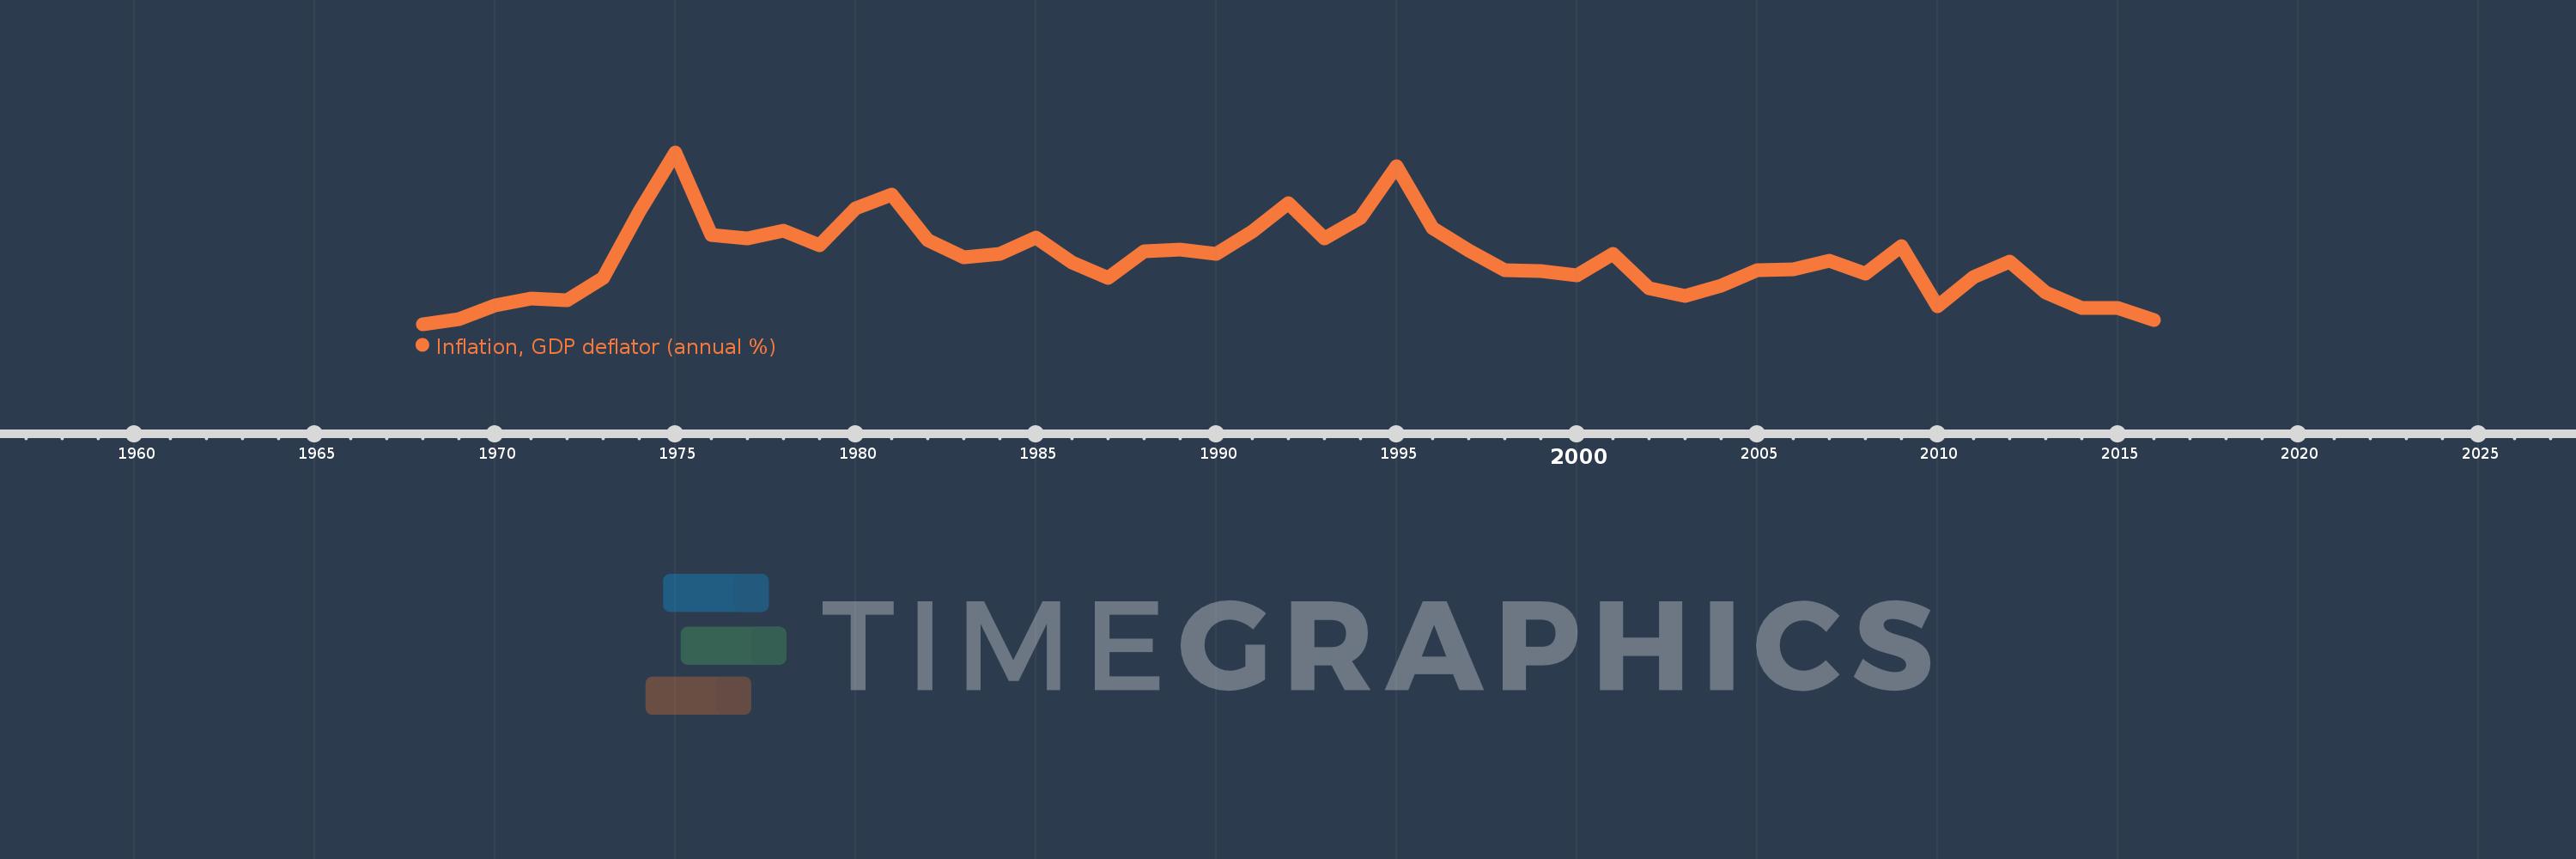
Inflation, GDP deflator (annual %)
2016,2015,2014,2013,2012,2011,2010,2009,2008,2007,2006,2005,2004,2003,2002,2001,2000,1999,1998,1997,1996,1995,1994,1993,1992,1991,1990,1989,1988,1987,1986,1985,1984,1983,1982,1981,1980,1979,1978,1977,1976,1975,1974,1973,1972,1971,1970,1969,1968
This statistics in other country:
AfghanistanAlbaniaAlgeriaAndorraAngolaAntigua and BarbudaArab WorldArgentinaArmeniaArubaAustraliaAustriaAzerbaijanBahamas, TheBahrainBangladeshBarbadosBelarusBelgiumBelizeBeninBermudaBhutanBoliviaBosnia and HerzegovinaBotswanaBrazilBrunei DarussalamBulgariaBurkina FasoBurundiCabo VerdeCambodiaCameroonCanadaCaribbean small statesCayman IslandsCentral African RepublicCentral Europe and the BalticsChadChannel IslandsChileChinaColombiaComorosCongo, Dem. Rep.Congo, Rep.Costa RicaCote d'IvoireCroatiaCubaCyprusCzech RepublicDenmarkDjiboutiDominicaDominican RepublicEarly-demographic dividendEast Asia & PacificEast Asia & Pacific (excluding high income)East Asia & Pacific (IDA & IBRD countries)EcuadorEgypt, Arab Rep.El SalvadorEquatorial GuineaEritreaEstoniaEthiopiaEuro areaEurope & Central AsiaEurope & Central Asia (excluding high income)Europe & Central Asia (IDA & IBRD countries)European UnionFijiFinlandFragile and conflict affected situationsFranceFrench PolynesiaGabonGambia, TheGeorgiaGermanyGhanaGreeceGreenlandGrenadaGuatemalaGuineaGuinea-BissauGuyanaHaitiHeavily indebted poor countries (HIPC)High incomeHondurasHong Kong SAR, ChinaHungaryIBRD onlyIcelandIDA & IBRD totalIDA blendIDA onlyIDA totalIndiaIndonesiaIran, Islamic Rep.IraqIrelandIsle of ManIsraelItalyJamaicaJapanJordanKazakhstanKenyaKiribatiKorea, Rep.KosovoKuwaitKyrgyz RepublicLao PDRLate-demographic dividendLatin America & Caribbean Latin America & Caribbean (excluding high income)Latin America & the Caribbean (IDA & IBRD countries)LatviaLeast developed countries: UN classificationLebanonLesothoLiberiaLibyaLiechtensteinLithuaniaLow & middle incomeLow incomeLower middle incomeLuxembourgMacao SAR, ChinaMacedonia, FYRMadagascarMalawiMalaysiaMaldivesMaliMaltaMarshall IslandsMauritaniaMauritiusMexicoMicronesia, Fed. Sts.Middle East & North AfricaMiddle East & North Africa (excluding high income)Middle East & North Africa (IDA & IBRD countries)Middle incomeMoldovaMonacoMongoliaMontenegroMoroccoMozambiqueMyanmarNamibiaNauruNepalNetherlandsNew CaledoniaNew ZealandNicaraguaNigerNigeriaNorth AmericaNorwayOECD membersOmanOther small statesPacific island small statesPakistanPalauPanamaPapua New GuineaParaguayPeruPhilippinesPolandPortugalPost-demographic dividendPre-demographic dividendPuerto RicoQatarRomaniaRussian FederationRwandaSamoaSan MarinoSao Tome and PrincipeSaudi ArabiaSenegalSerbiaSeychellesSierra LeoneSingaporeSlovak RepublicSloveniaSmall statesSolomon IslandsSomaliaSouth AfricaSouth AsiaSouth Asia (IDA & IBRD)South SudanSpainSri LankaSt. Kitts and NevisSt. LuciaSt. Vincent and the GrenadinesSub-Saharan Africa Sub-Saharan Africa (excluding high income)Sub-Saharan Africa (IDA & IBRD countries)SudanSurinameSwazilandSwedenSwitzerlandSyrian Arab RepublicTajikistanTanzaniaThailandTimor-LesteTogoTongaTrinidad and TobagoTunisiaTurkeyTurkmenistanTuvaluUgandaUkraineUnited Arab EmiratesUnited KingdomUnited StatesUpper middle incomeUruguayUzbekistanVanuatuVenezuela, RBVietnamVirgin Islands (U.S.)West Bank and GazaWorldYemen, Rep.ZambiaZimbabwe Timeline:
This timeline shows a graph from 1968 to 2016 of Low & middle income. No data until 1967. Number of actual observations by date: 49.
Source name:
World Development Indicators
Source organization:
World Bank national accounts data, and OECD National Accounts data files.
Categories, topics:
Economy & Growth
Last updated:
apr 23, 2017
Indicators value changes by year
Maximum:
18.297
jan 1, 1975
At the date of observation
Value
Absolute change
Change from previous value
jan 1, 1968
1.786
+1.786
0.0%
jan 1, 1969
2.267
+0.481
26.9%
jan 1, 1970
3.562
+1.295
57.14%
jan 1, 1971
4.283
+0.721
20.23%
jan 1, 1972
4.065
-0.218
-5.08%
jan 1, 1973
6.209
+2.144
52.74%
jan 1, 1974
12.576
+6.366
102.53%
jan 1, 1975
18.297
+5.721
45.5%
jan 1, 1976
10.39
-7.907
-43.21%
jan 1, 1977
10.038
-0.352
-3.39%
jan 1, 1978
10.742
+0.705
7.02%
jan 1, 1979
9.351
-1.391
-12.95%
jan 1, 1980
12.929
+3.577
38.25%
jan 1, 1981
14.246
+1.317
10.19%
jan 1, 1982
9.904
-4.342
-30.48%
jan 1, 1983
8.199
-1.706
-17.22%
jan 1, 1984
8.52
+0.322
3.92%
jan 1, 1985
10.116
+1.596
18.73%
jan 1, 1986
7.743
-2.374
-23.47%
jan 1, 1987
6.207
-1.536
-19.84%
jan 1, 1988
8.763
+2.556
41.19%
jan 1, 1989
8.94
+0.177
2.02%
jan 1, 1990
8.511
-0.429
-4.8%
jan 1, 1991
10.661
+2.15
25.26%
jan 1, 1992
13.407
+2.746
25.76%
jan 1, 1993
10.057
-3.35
-24.98%
jan 1, 1994
11.997
+1.94
19.29%
jan 1, 1995
16.952
+4.955
41.3%
jan 1, 1996
11.044
-5.909
-34.85%
jan 1, 1997
8.9
-2.144
-19.41%
jan 1, 1998
6.971
-1.929
-21.67%
jan 1, 1999
6.934
-0.038
-0.54%
jan 1, 2000
6.515
-0.419
-6.04%
jan 1, 2001
8.507
+1.992
30.57%
jan 1, 2002
5.211
-3.296
-38.74%
jan 1, 2003
4.488
-0.723
-13.88%
jan 1, 2004
5.487
+1.0
22.28%
jan 1, 2005
7.015
+1.528
27.84%
jan 1, 2006
7.027
+0.012
0.17%
jan 1, 2007
7.905
+0.878
12.5%
jan 1, 2008
6.651
-1.254
-15.87%
jan 1, 2009
9.29
+2.64
39.69%
jan 1, 2010
3.486
-5.804
-62.48%
jan 1, 2011
6.351
+2.865
82.2%
jan 1, 2012
7.779
+1.428
22.48%
jan 1, 2013
4.855
-2.924
-37.59%
jan 1, 2014
3.366
-1.488
-30.66%
jan 1, 2015
3.376
+0.01
0.29%
jan 1, 2016
2.222
-1.154
-34.19%
Ranking of countries by current statistics by years


Comments: