29
/
en
AIzaSyAYiBZKx7MnpbEhh9jyipgxe19OcubqV5w
April 1, 2024
69965
Argentina
ARG
true
2
1
Inflation, GDP deflator (annual %)
2016,2015,2014,2013,2012,2011,2010,2009,2008,2007,2006,2005,2004,2003,2002,2001,2000,1999,1998,1997,1996,1995,1994,1993,1992,1991,1990,1989,1988,1987,1986,1985,1984,1983,1982,1981,1980,1979,1978,1977,1976,1975,1974,1973,1972,1971,1970,1969,1968,1967,1966,1965,1964,1963,1962
This statistics in other country:
AfghanistanAlbaniaAlgeriaAndorraAngolaAntigua and BarbudaArab WorldArgentinaArmeniaArubaAustraliaAustriaAzerbaijanBahamas, TheBahrainBangladeshBarbadosBelarusBelgiumBelizeBeninBermudaBhutanBoliviaBosnia and HerzegovinaBotswanaBrazilBrunei DarussalamBulgariaBurkina FasoBurundiCabo VerdeCambodiaCameroonCanadaCaribbean small statesCayman IslandsCentral African RepublicCentral Europe and the BalticsChadChannel IslandsChileChinaColombiaComorosCongo, Dem. Rep.Congo, Rep.Costa RicaCote d'IvoireCroatiaCubaCyprusCzech RepublicDenmarkDjiboutiDominicaDominican RepublicEarly-demographic dividendEast Asia & PacificEast Asia & Pacific (excluding high income)East Asia & Pacific (IDA & IBRD countries)EcuadorEgypt, Arab Rep.El SalvadorEquatorial GuineaEritreaEstoniaEthiopiaEuro areaEurope & Central AsiaEurope & Central Asia (excluding high income)Europe & Central Asia (IDA & IBRD countries)European UnionFijiFinlandFragile and conflict affected situationsFranceFrench PolynesiaGabonGambia, TheGeorgiaGermanyGhanaGreeceGreenlandGrenadaGuatemalaGuineaGuinea-BissauGuyanaHaitiHeavily indebted poor countries (HIPC)High incomeHondurasHong Kong SAR, ChinaHungaryIBRD onlyIcelandIDA & IBRD totalIDA blendIDA onlyIDA totalIndiaIndonesiaIran, Islamic Rep.IraqIrelandIsle of ManIsraelItalyJamaicaJapanJordanKazakhstanKenyaKiribatiKorea, Rep.KosovoKuwaitKyrgyz RepublicLao PDRLate-demographic dividendLatin America & Caribbean Latin America & Caribbean (excluding high income)Latin America & the Caribbean (IDA & IBRD countries)LatviaLeast developed countries: UN classificationLebanonLesothoLiberiaLibyaLiechtensteinLithuaniaLow & middle incomeLow incomeLower middle incomeLuxembourgMacao SAR, ChinaMacedonia, FYRMadagascarMalawiMalaysiaMaldivesMaliMaltaMarshall IslandsMauritaniaMauritiusMexicoMicronesia, Fed. Sts.Middle East & North AfricaMiddle East & North Africa (excluding high income)Middle East & North Africa (IDA & IBRD countries)Middle incomeMoldovaMonacoMongoliaMontenegroMoroccoMozambiqueMyanmarNamibiaNauruNepalNetherlandsNew CaledoniaNew ZealandNicaraguaNigerNigeriaNorth AmericaNorwayOECD membersOmanOther small statesPacific island small statesPakistanPalauPanamaPapua New GuineaParaguayPeruPhilippinesPolandPortugalPost-demographic dividendPre-demographic dividendPuerto RicoQatarRomaniaRussian FederationRwandaSamoaSan MarinoSao Tome and PrincipeSaudi ArabiaSenegalSerbiaSeychellesSierra LeoneSingaporeSlovak RepublicSloveniaSmall statesSolomon IslandsSomaliaSouth AfricaSouth AsiaSouth Asia (IDA & IBRD)South SudanSpainSri LankaSt. Kitts and NevisSt. LuciaSt. Vincent and the GrenadinesSub-Saharan Africa Sub-Saharan Africa (excluding high income)Sub-Saharan Africa (IDA & IBRD countries)SudanSurinameSwazilandSwedenSwitzerlandSyrian Arab RepublicTajikistanTanzaniaThailandTimor-LesteTogoTongaTrinidad and TobagoTunisiaTurkeyTurkmenistanTuvaluUgandaUkraineUnited Arab EmiratesUnited KingdomUnited StatesUpper middle incomeUruguayUzbekistanVanuatuVenezuela, RBVietnamVirgin Islands (U.S.)West Bank and GazaWorldYemen, Rep.ZambiaZimbabwe Timeline:
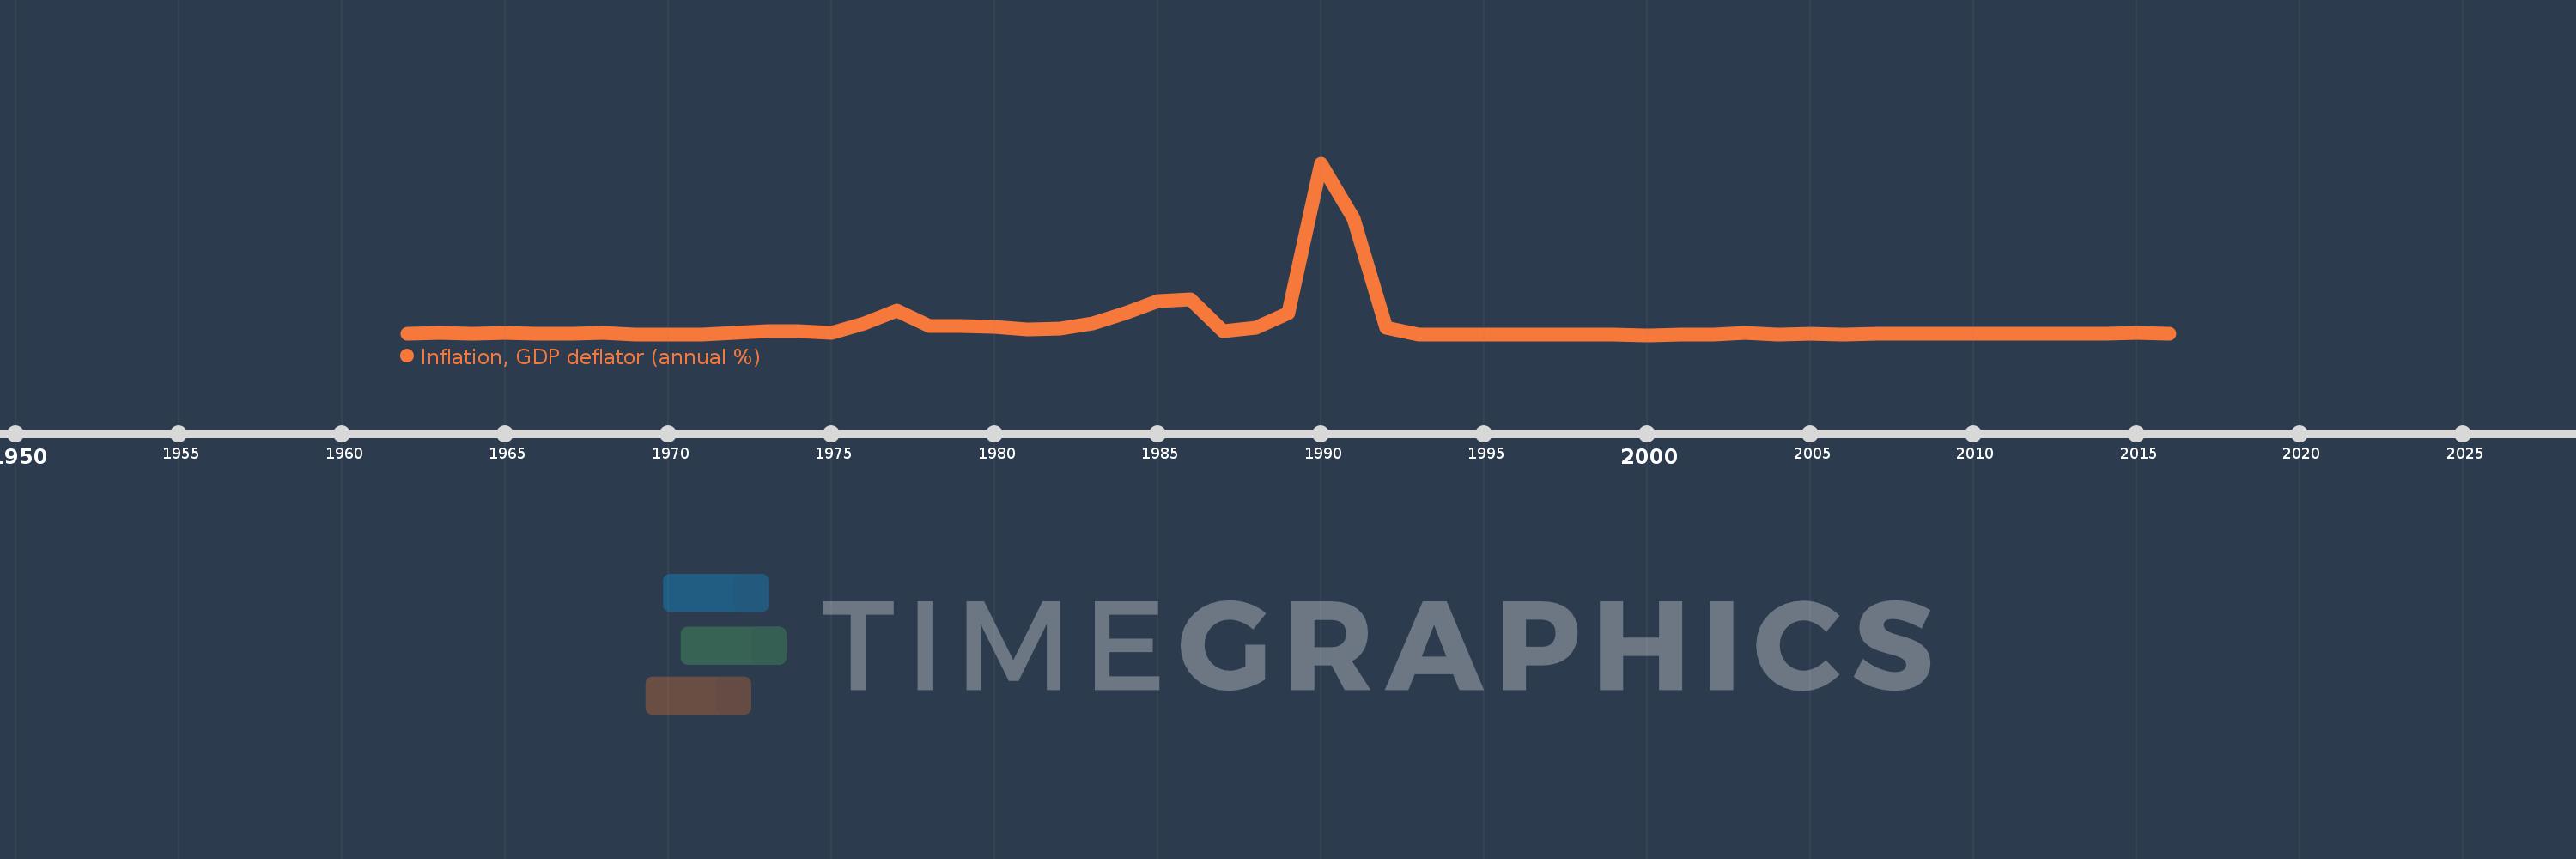
This timeline shows a graph from 1962 to 2016 of Argentina. No data until 1961. Number of actual observations by date: 55.
Source name:
World Development Indicators
Source organization:
World Bank national accounts data, and OECD National Accounts data files.
Categories, topics:
Economy & Growth
Last updated:
apr 23, 2017
Indicators value changes by year
Minimum:
-1.837
jan 1, 2000
Maximum:
3.058K
jan 1, 1990
At the date of observation
Value
Absolute change
Change from previous value
jan 1, 1962
20.311
+20.311
0.0%
jan 1, 1963
28.872
+8.561
42.15%
jan 1, 1964
25.591
-3.281
-11.36%
jan 1, 1965
28.775
+3.183
12.44%
jan 1, 1966
21.233
-7.542
-26.21%
jan 1, 1967
25.603
+4.371
20.58%
jan 1, 1968
29.018
+3.415
13.34%
jan 1, 1969
10.275
-18.743
-64.59%
jan 1, 1970
7.796
-2.479
-24.13%
jan 1, 1971
6.468
-1.328
-17.03%
jan 1, 1972
31.271
+24.803
383.48%
jan 1, 1973
64.245
+32.974
105.44%
jan 1, 1974
65.535
+1.291
2.01%
jan 1, 1975
30.63
-34.905
-53.26%
jan 1, 1976
197.697
+167.067
545.43%
jan 1, 1977
438.323
+240.625
121.71%
jan 1, 1978
159.427
-278.896
-63.63%
jan 1, 1979
161.372
+1.945
1.22%
jan 1, 1980
147.377
-13.995
-8.67%
jan 1, 1981
90.841
-56.536
-38.36%
jan 1, 1982
106.364
+15.523
17.09%
jan 1, 1983
207.618
+101.254
95.2%
jan 1, 1984
382.349
+174.732
84.16%
jan 1, 1985
606.736
+224.387
58.69%
jan 1, 1986
625.802
+19.066
3.14%
jan 1, 1987
74.461
-551.341
-88.1%
jan 1, 1988
127.086
+52.625
70.67%
jan 1, 1989
388.491
+261.405
205.69%
jan 1, 1990
3.058K
+2.669K
687.05%
jan 1, 1991
2.077K
-980.835
-32.08%
jan 1, 1992
132.953
-1.944K
-93.6%
jan 1, 1993
11.921
-121.032
-91.03%
jan 1, 1994
-1.467
-13.387
-112.3%
jan 1, 1995
2.849
+4.316
-294.27%
jan 1, 1996
3.165
+0.316
11.08%
jan 1, 1997
-0.052
-3.217
-101.65%
jan 1, 1998
-0.464
-0.412
785.74%
jan 1, 1999
-1.705
-1.241
267.59%
jan 1, 2000
-1.837
-0.131
7.7%
jan 1, 2001
1.037
+2.874
-156.48%
jan 1, 2002
-1.096
-2.133
-205.64%
jan 1, 2003
30.555
+31.651
-2.89K%
jan 1, 2004
10.496
-20.06
-65.65%
jan 1, 2005
18.363
+7.868
74.96%
jan 1, 2006
10.7
-7.663
-41.73%
jan 1, 2007
13.707
+3.007
28.1%
jan 1, 2008
14.946
+1.238
9.03%
jan 1, 2009
23.108
+8.162
54.61%
jan 1, 2010
15.515
-7.593
-32.86%
jan 1, 2011
20.768
+5.253
33.86%
jan 1, 2012
23.576
+2.808
13.52%
jan 1, 2013
22.309
-1.267
-5.38%
jan 1, 2014
23.882
+1.573
7.05%
jan 1, 2015
40.715
+16.832
70.48%
jan 1, 2016
23.748
-16.966
-41.67%
Ranking of countries by current statistics by years


Comments: