29
/
en
AIzaSyAYiBZKx7MnpbEhh9jyipgxe19OcubqV5w
April 1, 2024
195707
Mexico
MEX
true
2
1
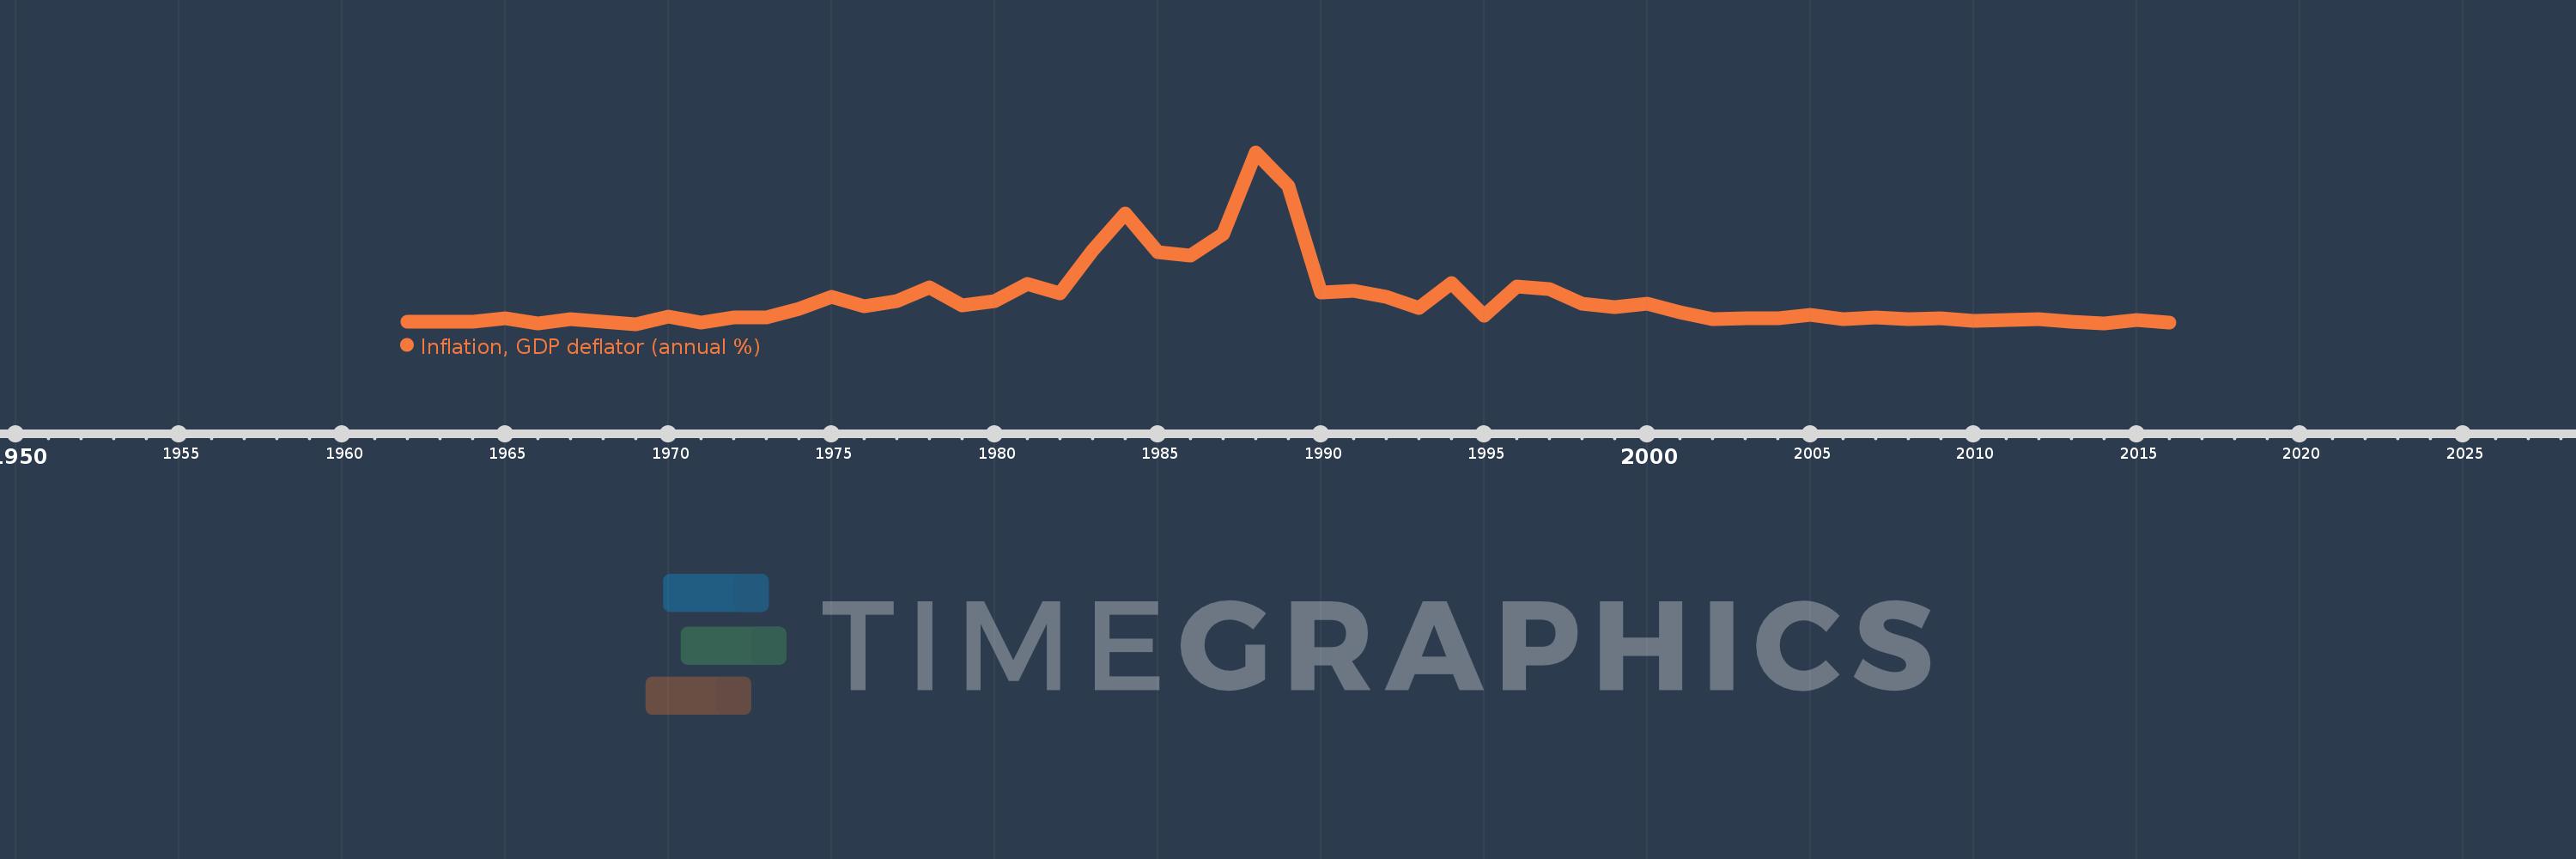
Inflation, GDP deflator (annual %)
2016,2015,2014,2013,2012,2011,2010,2009,2008,2007,2006,2005,2004,2003,2002,2001,2000,1999,1998,1997,1996,1995,1994,1993,1992,1991,1990,1989,1988,1987,1986,1985,1984,1983,1982,1981,1980,1979,1978,1977,1976,1975,1974,1973,1972,1971,1970,1969,1968,1967,1966,1965,1964,1963,1962
This statistics in other country:
AfghanistanAlbaniaAlgeriaAndorraAngolaAntigua and BarbudaArab WorldArgentinaArmeniaArubaAustraliaAustriaAzerbaijanBahamas, TheBahrainBangladeshBarbadosBelarusBelgiumBelizeBeninBermudaBhutanBoliviaBosnia and HerzegovinaBotswanaBrazilBrunei DarussalamBulgariaBurkina FasoBurundiCabo VerdeCambodiaCameroonCanadaCaribbean small statesCayman IslandsCentral African RepublicCentral Europe and the BalticsChadChannel IslandsChileChinaColombiaComorosCongo, Dem. Rep.Congo, Rep.Costa RicaCote d'IvoireCroatiaCubaCyprusCzech RepublicDenmarkDjiboutiDominicaDominican RepublicEarly-demographic dividendEast Asia & PacificEast Asia & Pacific (excluding high income)East Asia & Pacific (IDA & IBRD countries)EcuadorEgypt, Arab Rep.El SalvadorEquatorial GuineaEritreaEstoniaEthiopiaEuro areaEurope & Central AsiaEurope & Central Asia (excluding high income)Europe & Central Asia (IDA & IBRD countries)European UnionFijiFinlandFragile and conflict affected situationsFranceFrench PolynesiaGabonGambia, TheGeorgiaGermanyGhanaGreeceGreenlandGrenadaGuatemalaGuineaGuinea-BissauGuyanaHaitiHeavily indebted poor countries (HIPC)High incomeHondurasHong Kong SAR, ChinaHungaryIBRD onlyIcelandIDA & IBRD totalIDA blendIDA onlyIDA totalIndiaIndonesiaIran, Islamic Rep.IraqIrelandIsle of ManIsraelItalyJamaicaJapanJordanKazakhstanKenyaKiribatiKorea, Rep.KosovoKuwaitKyrgyz RepublicLao PDRLate-demographic dividendLatin America & Caribbean Latin America & Caribbean (excluding high income)Latin America & the Caribbean (IDA & IBRD countries)LatviaLeast developed countries: UN classificationLebanonLesothoLiberiaLibyaLiechtensteinLithuaniaLow & middle incomeLow incomeLower middle incomeLuxembourgMacao SAR, ChinaMacedonia, FYRMadagascarMalawiMalaysiaMaldivesMaliMaltaMarshall IslandsMauritaniaMauritiusMexicoMicronesia, Fed. Sts.Middle East & North AfricaMiddle East & North Africa (excluding high income)Middle East & North Africa (IDA & IBRD countries)Middle incomeMoldovaMonacoMongoliaMontenegroMoroccoMozambiqueMyanmarNamibiaNauruNepalNetherlandsNew CaledoniaNew ZealandNicaraguaNigerNigeriaNorth AmericaNorwayOECD membersOmanOther small statesPacific island small statesPakistanPalauPanamaPapua New GuineaParaguayPeruPhilippinesPolandPortugalPost-demographic dividendPre-demographic dividendPuerto RicoQatarRomaniaRussian FederationRwandaSamoaSan MarinoSao Tome and PrincipeSaudi ArabiaSenegalSerbiaSeychellesSierra LeoneSingaporeSlovak RepublicSloveniaSmall statesSolomon IslandsSomaliaSouth AfricaSouth AsiaSouth Asia (IDA & IBRD)South SudanSpainSri LankaSt. Kitts and NevisSt. LuciaSt. Vincent and the GrenadinesSub-Saharan Africa Sub-Saharan Africa (excluding high income)Sub-Saharan Africa (IDA & IBRD countries)SudanSurinameSwazilandSwedenSwitzerlandSyrian Arab RepublicTajikistanTanzaniaThailandTimor-LesteTogoTongaTrinidad and TobagoTunisiaTurkeyTurkmenistanTuvaluUgandaUkraineUnited Arab EmiratesUnited KingdomUnited StatesUpper middle incomeUruguayUzbekistanVanuatuVenezuela, RBVietnamVirgin Islands (U.S.)West Bank and GazaWorldYemen, Rep.ZambiaZimbabwe Timeline:
This timeline shows a graph from 1962 to 2016 of Mexico. No data until 1961. Number of actual observations by date: 55.
Source name:
World Development Indicators
Source organization:
World Bank national accounts data, and OECD National Accounts data files.
Categories, topics:
Economy & Growth
Last updated:
apr 23, 2017
Indicators value changes by year
Maximum:
139.659
jan 1, 1988
At the date of observation
Value
Absolute change
Change from previous value
jan 1, 1962
3.246
+3.246
0.0%
jan 1, 1963
2.747
-0.499
-15.38%
jan 1, 1964
2.925
+0.178
6.49%
jan 1, 1965
5.896
+2.971
101.56%
jan 1, 1966
1.557
-4.339
-73.6%
jan 1, 1967
5.081
+3.524
226.4%
jan 1, 1968
3.083
-1.998
-39.32%
jan 1, 1969
1.049
-2.034
-65.98%
jan 1, 1970
7.074
+6.025
574.5%
jan 1, 1971
2.632
-4.442
-62.79%
jan 1, 1972
6.296
+3.664
139.17%
jan 1, 1973
6.485
+0.189
3.0%
jan 1, 1974
13.424
+6.939
107.0%
jan 1, 1975
23.112
+9.688
72.16%
jan 1, 1976
15.625
-7.487
-32.39%
jan 1, 1977
19.355
+3.73
23.87%
jan 1, 1978
30.464
+11.108
57.39%
jan 1, 1979
16.006
-14.458
-47.46%
jan 1, 1980
19.634
+3.629
22.67%
jan 1, 1981
33.409
+13.775
70.16%
jan 1, 1982
26.009
-7.4
-22.15%
jan 1, 1983
60.922
+34.913
134.23%
jan 1, 1984
90.471
+29.548
48.5%
jan 1, 1985
59.093
-31.377
-34.68%
jan 1, 1986
56.741
-2.353
-3.98%
jan 1, 1987
73.619
+16.879
29.75%
jan 1, 1988
139.659
+66.039
89.7%
jan 1, 1989
112.706
-26.953
-19.3%
jan 1, 1990
26.528
-86.177
-76.46%
jan 1, 1991
28.13
+1.602
6.04%
jan 1, 1992
23.251
-4.88
-17.35%
jan 1, 1993
14.411
-8.84
-38.02%
jan 1, 1994
34.082
+19.67
136.5%
jan 1, 1995
8.233
-25.849
-75.84%
jan 1, 1996
31.58
+23.347
283.58%
jan 1, 1997
29.249
-2.331
-7.38%
jan 1, 1998
17.799
-11.45
-39.15%
jan 1, 1999
15.114
-2.685
-15.08%
jan 1, 2000
17.652
+2.538
16.79%
jan 1, 2001
10.818
-6.835
-38.72%
jan 1, 2002
5.373
-5.444
-50.33%
jan 1, 2003
5.623
+0.249
4.64%
jan 1, 2004
5.966
+0.343
6.1%
jan 1, 2005
8.311
+2.345
39.31%
jan 1, 2006
5.409
-2.902
-34.91%
jan 1, 2007
6.183
+0.774
14.31%
jan 1, 2008
5.023
-1.16
-18.76%
jan 1, 2009
6.001
+0.978
19.48%
jan 1, 2010
3.537
-2.464
-41.06%
jan 1, 2011
4.485
+0.948
26.81%
jan 1, 2012
5.288
+0.803
17.9%
jan 1, 2013
3.252
-2.035
-38.49%
jan 1, 2014
1.759
-1.494
-45.92%
jan 1, 2015
4.709
+2.95
167.75%
jan 1, 2016
2.521
-2.188
-46.46%
Ranking of countries by current statistics by years


Comments: