29
/
en
AIzaSyAYiBZKx7MnpbEhh9jyipgxe19OcubqV5w
April 1, 2024
266988
Trinidad and Tobago
TTO
true
2
1
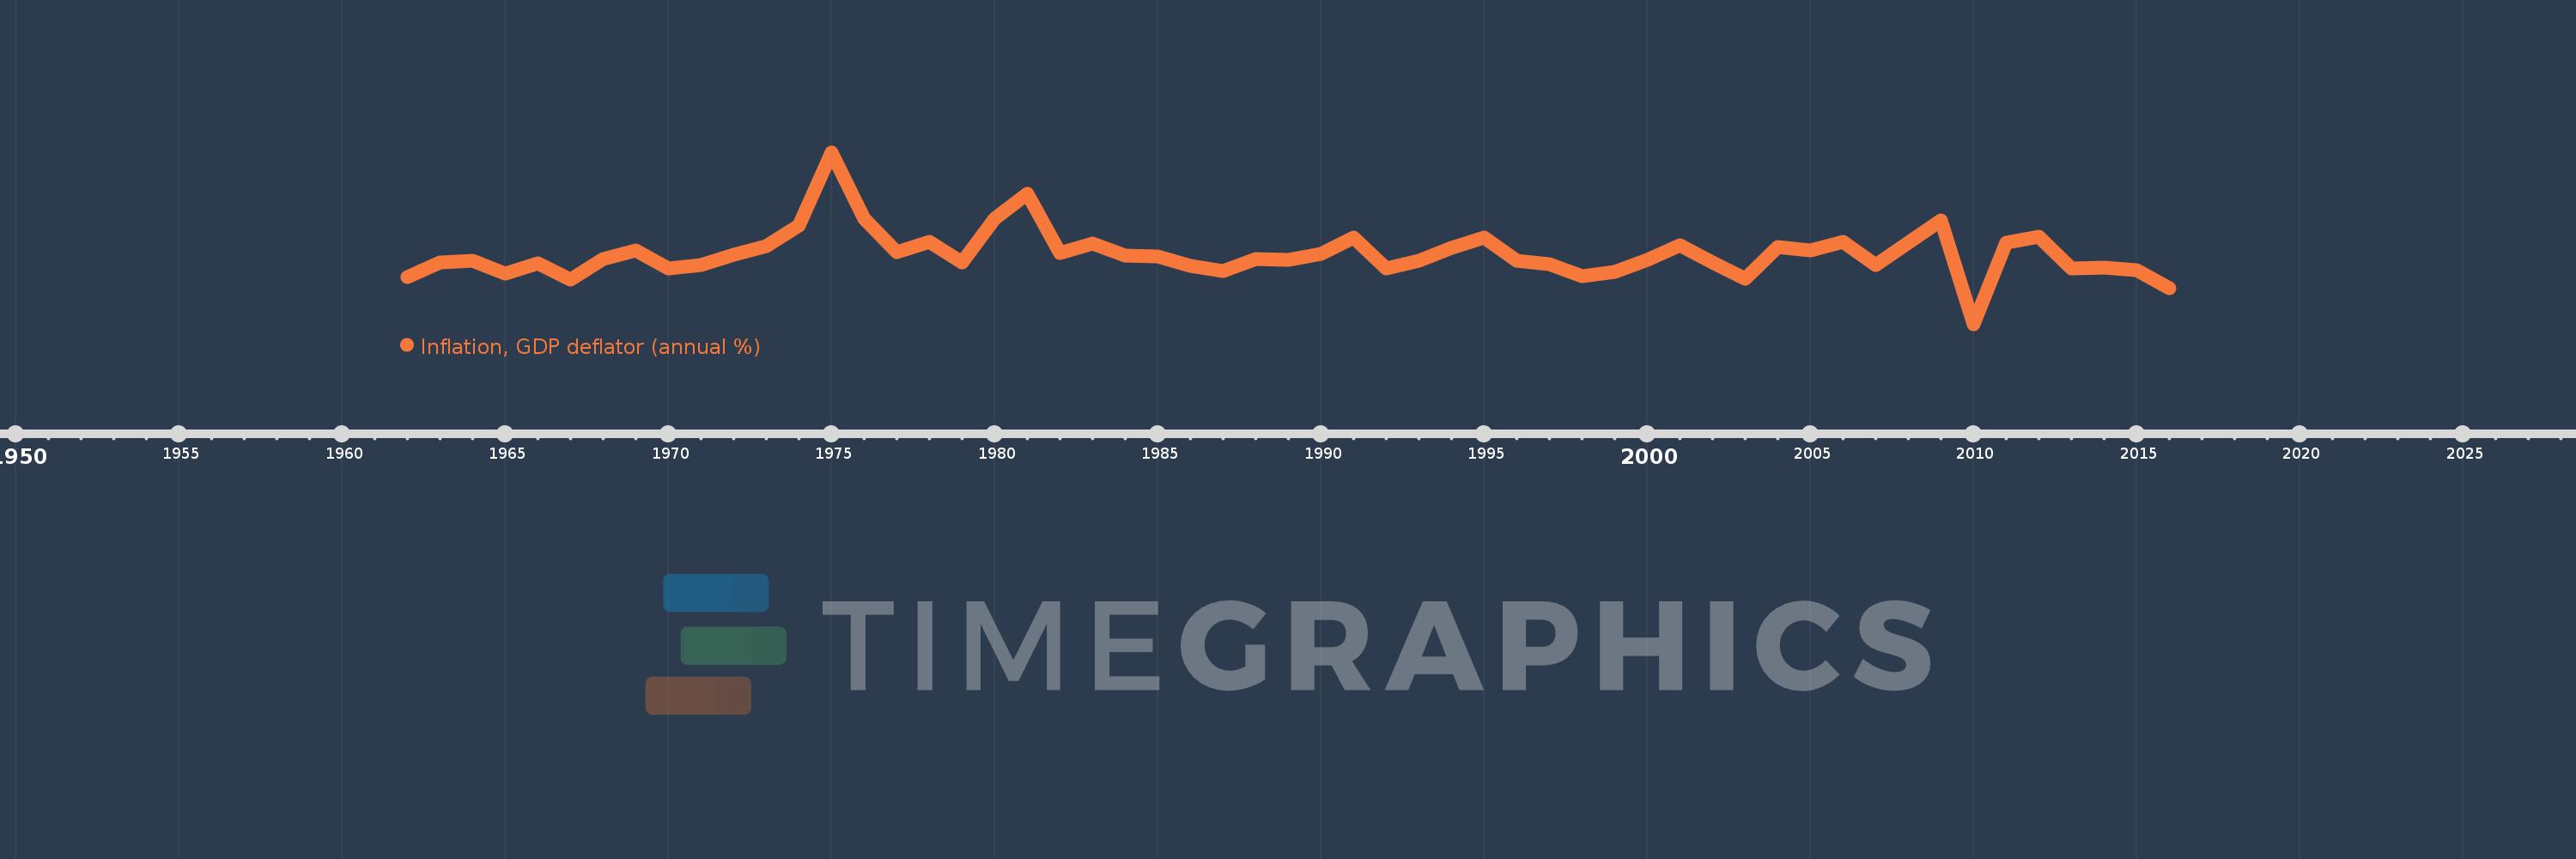
Inflation, GDP deflator (annual %)
2016,2015,2014,2013,2012,2011,2010,2009,2008,2007,2006,2005,2004,2003,2002,2001,2000,1999,1998,1997,1996,1995,1994,1993,1992,1991,1990,1989,1988,1987,1986,1985,1984,1983,1982,1981,1980,1979,1978,1977,1976,1975,1974,1973,1972,1971,1970,1969,1968,1967,1966,1965,1964,1963,1962
This statistics in other country:
AfghanistanAlbaniaAlgeriaAndorraAngolaAntigua and BarbudaArab WorldArgentinaArmeniaArubaAustraliaAustriaAzerbaijanBahamas, TheBahrainBangladeshBarbadosBelarusBelgiumBelizeBeninBermudaBhutanBoliviaBosnia and HerzegovinaBotswanaBrazilBrunei DarussalamBulgariaBurkina FasoBurundiCabo VerdeCambodiaCameroonCanadaCaribbean small statesCayman IslandsCentral African RepublicCentral Europe and the BalticsChadChannel IslandsChileChinaColombiaComorosCongo, Dem. Rep.Congo, Rep.Costa RicaCote d'IvoireCroatiaCubaCyprusCzech RepublicDenmarkDjiboutiDominicaDominican RepublicEarly-demographic dividendEast Asia & PacificEast Asia & Pacific (excluding high income)East Asia & Pacific (IDA & IBRD countries)EcuadorEgypt, Arab Rep.El SalvadorEquatorial GuineaEritreaEstoniaEthiopiaEuro areaEurope & Central AsiaEurope & Central Asia (excluding high income)Europe & Central Asia (IDA & IBRD countries)European UnionFijiFinlandFragile and conflict affected situationsFranceFrench PolynesiaGabonGambia, TheGeorgiaGermanyGhanaGreeceGreenlandGrenadaGuatemalaGuineaGuinea-BissauGuyanaHaitiHeavily indebted poor countries (HIPC)High incomeHondurasHong Kong SAR, ChinaHungaryIBRD onlyIcelandIDA & IBRD totalIDA blendIDA onlyIDA totalIndiaIndonesiaIran, Islamic Rep.IraqIrelandIsle of ManIsraelItalyJamaicaJapanJordanKazakhstanKenyaKiribatiKorea, Rep.KosovoKuwaitKyrgyz RepublicLao PDRLate-demographic dividendLatin America & Caribbean Latin America & Caribbean (excluding high income)Latin America & the Caribbean (IDA & IBRD countries)LatviaLeast developed countries: UN classificationLebanonLesothoLiberiaLibyaLiechtensteinLithuaniaLow & middle incomeLow incomeLower middle incomeLuxembourgMacao SAR, ChinaMacedonia, FYRMadagascarMalawiMalaysiaMaldivesMaliMaltaMarshall IslandsMauritaniaMauritiusMexicoMicronesia, Fed. Sts.Middle East & North AfricaMiddle East & North Africa (excluding high income)Middle East & North Africa (IDA & IBRD countries)Middle incomeMoldovaMonacoMongoliaMontenegroMoroccoMozambiqueMyanmarNamibiaNauruNepalNetherlandsNew CaledoniaNew ZealandNicaraguaNigerNigeriaNorth AmericaNorwayOECD membersOmanOther small statesPacific island small statesPakistanPalauPanamaPapua New GuineaParaguayPeruPhilippinesPolandPortugalPost-demographic dividendPre-demographic dividendPuerto RicoQatarRomaniaRussian FederationRwandaSamoaSan MarinoSao Tome and PrincipeSaudi ArabiaSenegalSerbiaSeychellesSierra LeoneSingaporeSlovak RepublicSloveniaSmall statesSolomon IslandsSomaliaSouth AfricaSouth AsiaSouth Asia (IDA & IBRD)South SudanSpainSri LankaSt. Kitts and NevisSt. LuciaSt. Vincent and the GrenadinesSub-Saharan Africa Sub-Saharan Africa (excluding high income)Sub-Saharan Africa (IDA & IBRD countries)SudanSurinameSwazilandSwedenSwitzerlandSyrian Arab RepublicTajikistanTanzaniaThailandTimor-LesteTogoTongaTrinidad and TobagoTunisiaTurkeyTurkmenistanTuvaluUgandaUkraineUnited Arab EmiratesUnited KingdomUnited StatesUpper middle incomeUruguayUzbekistanVanuatuVenezuela, RBVietnamVirgin Islands (U.S.)West Bank and GazaWorldYemen, Rep.ZambiaZimbabwe Timeline:
This timeline shows a graph from 1962 to 2016 of Trinidad and Tobago. No data until 1961. Number of actual observations by date: 55.
Source name:
World Development Indicators
Source organization:
World Bank national accounts data, and OECD National Accounts data files.
Categories, topics:
Economy & Growth
Last updated:
apr 23, 2017
Indicators value changes by year
Minimum:
-27.633
jan 1, 2010
Maximum:
57.512
jan 1, 1975
At the date of observation
Value
Absolute change
Change from previous value
jan 1, 1962
-4.24
-4.24
0.0%
jan 1, 1963
3.048
+7.288
-171.87%
jan 1, 1964
3.701
+0.654
21.44%
jan 1, 1965
-2.479
-6.18
-166.98%
jan 1, 1966
2.753
+5.232
-211.07%
jan 1, 1967
-5.573
-8.326
-302.42%
jan 1, 1968
4.61
+10.183
-182.71%
jan 1, 1969
8.922
+4.313
93.56%
jan 1, 1970
-0.054
-8.977
-100.61%
jan 1, 1971
1.874
+1.928
-3.55K%
jan 1, 1972
6.635
+4.762
254.13%
jan 1, 1973
11.11
+4.475
67.43%
jan 1, 1974
21.183
+10.073
90.66%
jan 1, 1975
57.512
+36.329
171.5%
jan 1, 1976
24.571
-32.94
-57.28%
jan 1, 1977
7.996
-16.576
-67.46%
jan 1, 1978
13.342
+5.347
66.87%
jan 1, 1979
3.165
-10.177
-76.28%
jan 1, 1980
24.708
+21.543
680.71%
jan 1, 1981
36.95
+12.242
49.55%
jan 1, 1982
7.592
-29.358
-79.45%
jan 1, 1983
12.151
+4.56
60.06%
jan 1, 1984
6.34
-5.811
-47.82%
jan 1, 1985
6.011
-0.329
-5.2%
jan 1, 1986
1.24
-4.771
-79.38%
jan 1, 1987
-1.247
-2.487
-200.59%
jan 1, 1988
4.852
+6.099
-489.13%
jan 1, 1989
4.156
-0.697
-14.36%
jan 1, 1990
7.181
+3.025
72.8%
jan 1, 1991
15.49
+8.309
115.71%
jan 1, 1992
-0.014
-15.503
-100.09%
jan 1, 1993
3.923
+3.936
-29.15K%
jan 1, 1994
10.062
+6.139
156.51%
jan 1, 1995
15.448
+5.386
53.53%
jan 1, 1996
4.023
-11.425
-73.96%
jan 1, 1997
1.938
-2.085
-51.83%
jan 1, 1998
-3.691
-5.629
-290.5%
jan 1, 1999
-1.849
+1.843
-49.92%
jan 1, 2000
4.303
+6.152
-332.79%
jan 1, 2001
11.357
+7.054
163.91%
jan 1, 2002
2.794
-8.563
-75.4%
jan 1, 2003
-5.193
-7.986
-285.85%
jan 1, 2004
10.478
+15.671
-301.79%
jan 1, 2005
8.885
-1.593
-15.21%
jan 1, 2006
13.321
+4.437
49.94%
jan 1, 2007
1.729
-11.592
-87.02%
jan 1, 2008
12.752
+11.023
637.44%
jan 1, 2009
23.794
+11.042
86.59%
jan 1, 2010
-27.633
-51.427
-216.13%
jan 1, 2011
12.733
+40.366
-146.08%
jan 1, 2012
15.73
+2.996
23.53%
jan 1, 2013
0.052
-15.678
-99.67%
jan 1, 2014
0.431
+0.379
725.87%
jan 1, 2015
-0.929
-1.36
-315.68%
jan 1, 2016
-9.92
-8.991
967.88%
Ranking of countries by current statistics by years


Comments: