29
/
en
AIzaSyAYiBZKx7MnpbEhh9jyipgxe19OcubqV5w
April 1, 2024
111089
Congo, Rep.
COG
true
2
1
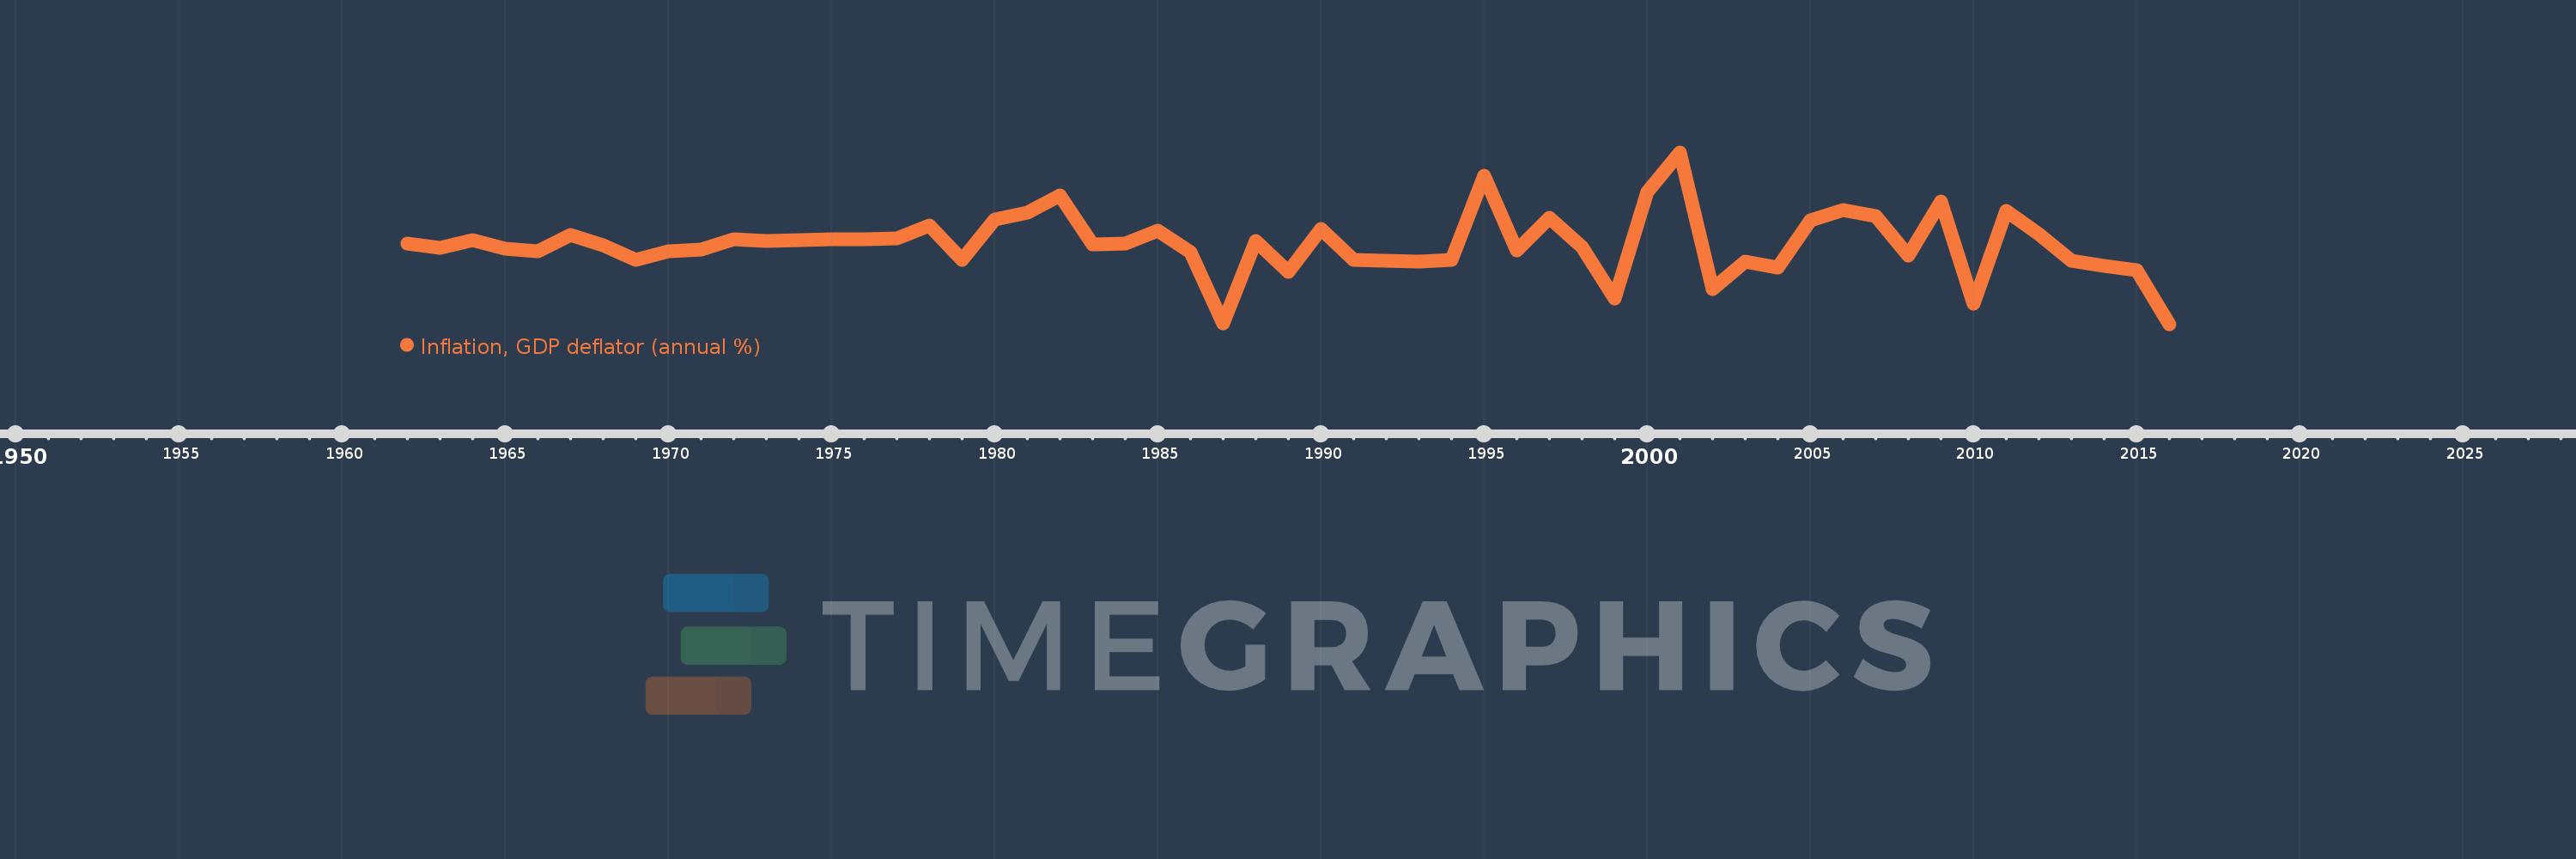
Inflation, GDP deflator (annual %)
2016,2015,2014,2013,2012,2011,2010,2009,2008,2007,2006,2005,2004,2003,2002,2001,2000,1999,1998,1997,1996,1995,1994,1993,1992,1991,1990,1989,1988,1987,1986,1985,1984,1983,1982,1981,1980,1979,1978,1977,1976,1975,1974,1973,1972,1971,1970,1969,1968,1967,1966,1965,1964,1963,1962
This statistics in other country:
AfghanistanAlbaniaAlgeriaAndorraAngolaAntigua and BarbudaArab WorldArgentinaArmeniaArubaAustraliaAustriaAzerbaijanBahamas, TheBahrainBangladeshBarbadosBelarusBelgiumBelizeBeninBermudaBhutanBoliviaBosnia and HerzegovinaBotswanaBrazilBrunei DarussalamBulgariaBurkina FasoBurundiCabo VerdeCambodiaCameroonCanadaCaribbean small statesCayman IslandsCentral African RepublicCentral Europe and the BalticsChadChannel IslandsChileChinaColombiaComorosCongo, Dem. Rep.Congo, Rep.Costa RicaCote d'IvoireCroatiaCubaCyprusCzech RepublicDenmarkDjiboutiDominicaDominican RepublicEarly-demographic dividendEast Asia & PacificEast Asia & Pacific (excluding high income)East Asia & Pacific (IDA & IBRD countries)EcuadorEgypt, Arab Rep.El SalvadorEquatorial GuineaEritreaEstoniaEthiopiaEuro areaEurope & Central AsiaEurope & Central Asia (excluding high income)Europe & Central Asia (IDA & IBRD countries)European UnionFijiFinlandFragile and conflict affected situationsFranceFrench PolynesiaGabonGambia, TheGeorgiaGermanyGhanaGreeceGreenlandGrenadaGuatemalaGuineaGuinea-BissauGuyanaHaitiHeavily indebted poor countries (HIPC)High incomeHondurasHong Kong SAR, ChinaHungaryIBRD onlyIcelandIDA & IBRD totalIDA blendIDA onlyIDA totalIndiaIndonesiaIran, Islamic Rep.IraqIrelandIsle of ManIsraelItalyJamaicaJapanJordanKazakhstanKenyaKiribatiKorea, Rep.KosovoKuwaitKyrgyz RepublicLao PDRLate-demographic dividendLatin America & Caribbean Latin America & Caribbean (excluding high income)Latin America & the Caribbean (IDA & IBRD countries)LatviaLeast developed countries: UN classificationLebanonLesothoLiberiaLibyaLiechtensteinLithuaniaLow & middle incomeLow incomeLower middle incomeLuxembourgMacao SAR, ChinaMacedonia, FYRMadagascarMalawiMalaysiaMaldivesMaliMaltaMarshall IslandsMauritaniaMauritiusMexicoMicronesia, Fed. Sts.Middle East & North AfricaMiddle East & North Africa (excluding high income)Middle East & North Africa (IDA & IBRD countries)Middle incomeMoldovaMonacoMongoliaMontenegroMoroccoMozambiqueMyanmarNamibiaNauruNepalNetherlandsNew CaledoniaNew ZealandNicaraguaNigerNigeriaNorth AmericaNorwayOECD membersOmanOther small statesPacific island small statesPakistanPalauPanamaPapua New GuineaParaguayPeruPhilippinesPolandPortugalPost-demographic dividendPre-demographic dividendPuerto RicoQatarRomaniaRussian FederationRwandaSamoaSan MarinoSao Tome and PrincipeSaudi ArabiaSenegalSerbiaSeychellesSierra LeoneSingaporeSlovak RepublicSloveniaSmall statesSolomon IslandsSomaliaSouth AfricaSouth AsiaSouth Asia (IDA & IBRD)South SudanSpainSri LankaSt. Kitts and NevisSt. LuciaSt. Vincent and the GrenadinesSub-Saharan Africa Sub-Saharan Africa (excluding high income)Sub-Saharan Africa (IDA & IBRD countries)SudanSurinameSwazilandSwedenSwitzerlandSyrian Arab RepublicTajikistanTanzaniaThailandTimor-LesteTogoTongaTrinidad and TobagoTunisiaTurkeyTurkmenistanTuvaluUgandaUkraineUnited Arab EmiratesUnited KingdomUnited StatesUpper middle incomeUruguayUzbekistanVanuatuVenezuela, RBVietnamVirgin Islands (U.S.)West Bank and GazaWorldYemen, Rep.ZambiaZimbabwe Timeline:
This timeline shows a graph from 1962 to 2016 of Congo, Rep.. No data until 1961. Number of actual observations by date: 55.
Source name:
World Development Indicators
Source organization:
World Bank national accounts data, and OECD National Accounts data files.
Categories, topics:
Economy & Growth
Last updated:
apr 23, 2017
Indicators value changes by year
Minimum:
-29.691
jan 1, 2016
At the date of observation
Value
Absolute change
Change from previous value
jan 1, 1962
6.294
+6.294
0.0%
jan 1, 1963
4.254
-2.04
-32.41%
jan 1, 1964
7.774
+3.52
82.75%
jan 1, 1965
3.856
-3.918
-50.4%
jan 1, 1966
3.025
-0.83
-21.54%
jan 1, 1967
10.027
+7.002
231.43%
jan 1, 1968
5.516
-4.511
-44.99%
jan 1, 1969
-1.045
-6.561
-118.94%
jan 1, 1970
2.997
+4.042
-386.86%
jan 1, 1971
3.71
+0.714
23.81%
jan 1, 1972
8.313
+4.603
124.04%
jan 1, 1973
7.428
-0.885
-10.65%
jan 1, 1974
7.839
+0.411
5.53%
jan 1, 1975
8.114
+0.275
3.51%
jan 1, 1976
8.305
+0.191
2.35%
jan 1, 1977
8.676
+0.371
4.47%
jan 1, 1978
14.525
+5.849
67.42%
jan 1, 1979
-0.828
-15.353
-105.7%
jan 1, 1980
17.102
+17.93
-2.16K%
jan 1, 1981
20.144
+3.042
17.79%
jan 1, 1982
27.789
+7.645
37.95%
jan 1, 1983
6.045
-21.744
-78.25%
jan 1, 1984
6.338
+0.294
4.86%
jan 1, 1985
12.111
+5.773
91.08%
jan 1, 1986
2.499
-9.613
-79.37%
jan 1, 1987
-29.173
-31.671
-1.27K%
jan 1, 1988
7.627
+36.799
-126.14%
jan 1, 1989
-6.226
-13.853
-181.64%
jan 1, 1990
12.744
+18.97
-304.68%
jan 1, 1991
-1.029
-13.773
-108.07%
jan 1, 1992
-1.481
-0.452
43.88%
jan 1, 1993
-1.569
-0.089
5.99%
jan 1, 1994
-1.131
+0.438
-27.94%
jan 1, 1995
36.753
+37.884
-3.35K%
jan 1, 1996
3.396
-33.357
-90.76%
jan 1, 1997
17.992
+14.596
429.81%
jan 1, 1998
4.965
-13.027
-72.41%
jan 1, 1999
-18.222
-23.187
-467.05%
jan 1, 2000
29.355
+47.577
-261.1%
jan 1, 2001
47.04
+17.685
60.24%
jan 1, 2002
-13.925
-60.965
-129.6%
jan 1, 2003
-1.739
+12.186
-87.51%
jan 1, 2004
-4.252
-2.513
144.49%
jan 1, 2005
16.807
+21.059
-495.32%
jan 1, 2006
21.329
+4.522
26.91%
jan 1, 2007
18.519
-2.81
-13.17%
jan 1, 2008
1.122
-17.397
-93.94%
jan 1, 2009
25.028
+23.905
2.13K%
jan 1, 2010
-20.627
-45.655
-182.42%
jan 1, 2011
20.722
+41.349
-200.46%
jan 1, 2012
10.67
-10.052
-48.51%
jan 1, 2013
-1.17
-11.84
-110.96%
jan 1, 2014
-3.658
-2.488
212.68%
jan 1, 2015
-5.669
-2.011
54.97%
jan 1, 2016
-29.691
-24.022
423.74%
Ranking of countries by current statistics by years


Comments: