29
/
en
AIzaSyAYiBZKx7MnpbEhh9jyipgxe19OcubqV5w
April 1, 2024
119054
Denmark
DNK
true
2
1
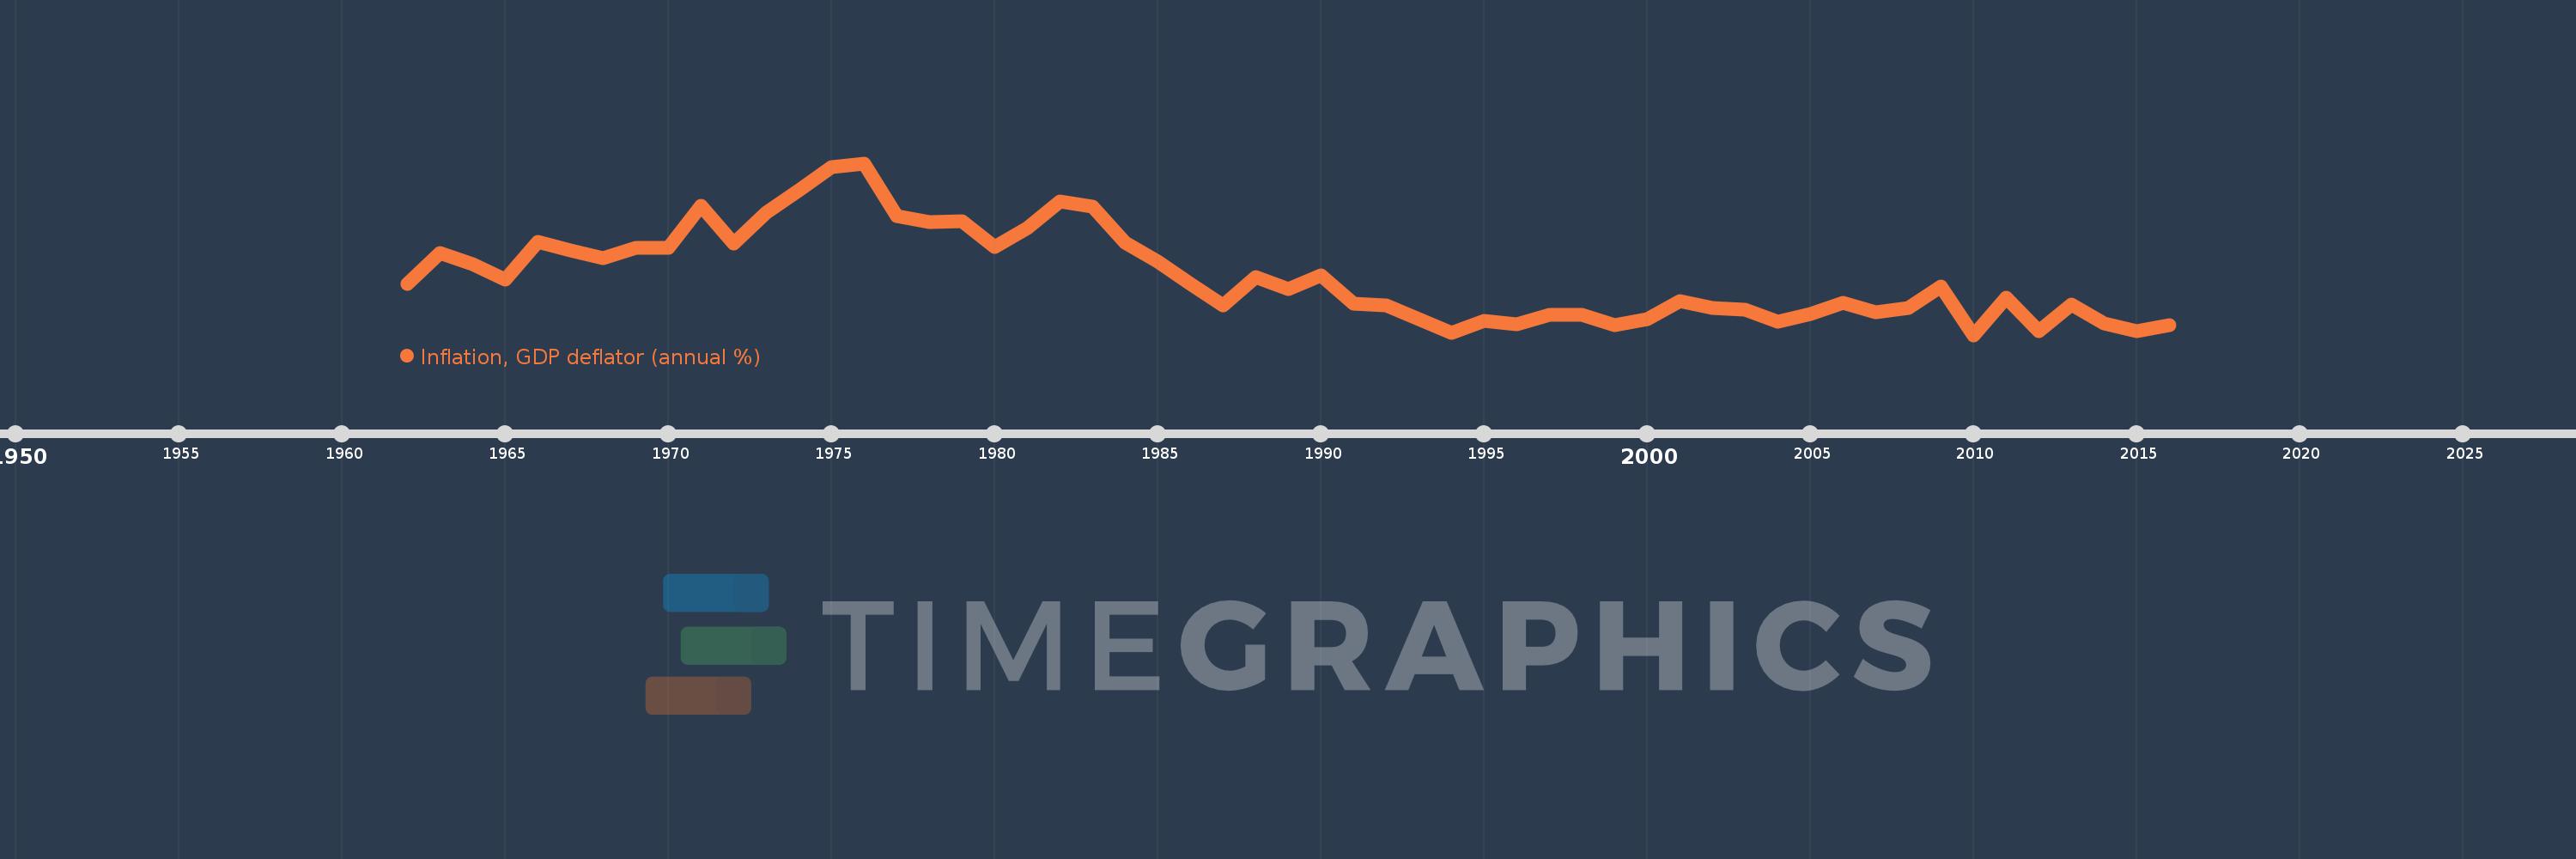
Inflation, GDP deflator (annual %)
2016,2015,2014,2013,2012,2011,2010,2009,2008,2007,2006,2005,2004,2003,2002,2001,2000,1999,1998,1997,1996,1995,1994,1993,1992,1991,1990,1989,1988,1987,1986,1985,1984,1983,1982,1981,1980,1979,1978,1977,1976,1975,1974,1973,1972,1971,1970,1969,1968,1967,1966,1965,1964,1963,1962
This statistics in other country:
AfghanistanAlbaniaAlgeriaAndorraAngolaAntigua and BarbudaArab WorldArgentinaArmeniaArubaAustraliaAustriaAzerbaijanBahamas, TheBahrainBangladeshBarbadosBelarusBelgiumBelizeBeninBermudaBhutanBoliviaBosnia and HerzegovinaBotswanaBrazilBrunei DarussalamBulgariaBurkina FasoBurundiCabo VerdeCambodiaCameroonCanadaCaribbean small statesCayman IslandsCentral African RepublicCentral Europe and the BalticsChadChannel IslandsChileChinaColombiaComorosCongo, Dem. Rep.Congo, Rep.Costa RicaCote d'IvoireCroatiaCubaCyprusCzech RepublicDenmarkDjiboutiDominicaDominican RepublicEarly-demographic dividendEast Asia & PacificEast Asia & Pacific (excluding high income)East Asia & Pacific (IDA & IBRD countries)EcuadorEgypt, Arab Rep.El SalvadorEquatorial GuineaEritreaEstoniaEthiopiaEuro areaEurope & Central AsiaEurope & Central Asia (excluding high income)Europe & Central Asia (IDA & IBRD countries)European UnionFijiFinlandFragile and conflict affected situationsFranceFrench PolynesiaGabonGambia, TheGeorgiaGermanyGhanaGreeceGreenlandGrenadaGuatemalaGuineaGuinea-BissauGuyanaHaitiHeavily indebted poor countries (HIPC)High incomeHondurasHong Kong SAR, ChinaHungaryIBRD onlyIcelandIDA & IBRD totalIDA blendIDA onlyIDA totalIndiaIndonesiaIran, Islamic Rep.IraqIrelandIsle of ManIsraelItalyJamaicaJapanJordanKazakhstanKenyaKiribatiKorea, Rep.KosovoKuwaitKyrgyz RepublicLao PDRLate-demographic dividendLatin America & Caribbean Latin America & Caribbean (excluding high income)Latin America & the Caribbean (IDA & IBRD countries)LatviaLeast developed countries: UN classificationLebanonLesothoLiberiaLibyaLiechtensteinLithuaniaLow & middle incomeLow incomeLower middle incomeLuxembourgMacao SAR, ChinaMacedonia, FYRMadagascarMalawiMalaysiaMaldivesMaliMaltaMarshall IslandsMauritaniaMauritiusMexicoMicronesia, Fed. Sts.Middle East & North AfricaMiddle East & North Africa (excluding high income)Middle East & North Africa (IDA & IBRD countries)Middle incomeMoldovaMonacoMongoliaMontenegroMoroccoMozambiqueMyanmarNamibiaNauruNepalNetherlandsNew CaledoniaNew ZealandNicaraguaNigerNigeriaNorth AmericaNorwayOECD membersOmanOther small statesPacific island small statesPakistanPalauPanamaPapua New GuineaParaguayPeruPhilippinesPolandPortugalPost-demographic dividendPre-demographic dividendPuerto RicoQatarRomaniaRussian FederationRwandaSamoaSan MarinoSao Tome and PrincipeSaudi ArabiaSenegalSerbiaSeychellesSierra LeoneSingaporeSlovak RepublicSloveniaSmall statesSolomon IslandsSomaliaSouth AfricaSouth AsiaSouth Asia (IDA & IBRD)South SudanSpainSri LankaSt. Kitts and NevisSt. LuciaSt. Vincent and the GrenadinesSub-Saharan Africa Sub-Saharan Africa (excluding high income)Sub-Saharan Africa (IDA & IBRD countries)SudanSurinameSwazilandSwedenSwitzerlandSyrian Arab RepublicTajikistanTanzaniaThailandTimor-LesteTogoTongaTrinidad and TobagoTunisiaTurkeyTurkmenistanTuvaluUgandaUkraineUnited Arab EmiratesUnited KingdomUnited StatesUpper middle incomeUruguayUzbekistanVanuatuVenezuela, RBVietnamVirgin Islands (U.S.)West Bank and GazaWorldYemen, Rep.ZambiaZimbabwe Timeline:
This timeline shows a graph from 1962 to 2016 of Denmark. No data until 1961. Number of actual observations by date: 55.
Source name:
World Development Indicators
Source organization:
World Bank national accounts data, and OECD National Accounts data files.
Categories, topics:
Economy & Growth
Last updated:
apr 23, 2017
Indicators value changes by year
Maximum:
13.324
jan 1, 1976
At the date of observation
Value
Absolute change
Change from previous value
jan 1, 1962
4.307
+4.307
0.0%
jan 1, 1963
6.636
+2.329
54.09%
jan 1, 1964
5.773
-0.862
-13.0%
jan 1, 1965
4.611
-1.162
-20.13%
jan 1, 1966
7.436
+2.825
61.28%
jan 1, 1967
6.833
-0.604
-8.12%
jan 1, 1968
6.25
-0.583
-8.53%
jan 1, 1969
6.999
+0.749
11.99%
jan 1, 1970
6.974
-0.025
-0.36%
jan 1, 1971
10.139
+3.165
45.39%
jan 1, 1972
7.286
-2.853
-28.14%
jan 1, 1973
9.599
+2.313
31.74%
jan 1, 1974
11.271
+1.673
17.43%
jan 1, 1975
13.055
+1.783
15.82%
jan 1, 1976
13.324
+0.269
2.06%
jan 1, 1977
9.383
-3.941
-29.58%
jan 1, 1978
8.928
-0.455
-4.85%
jan 1, 1979
9.014
+0.086
0.97%
jan 1, 1980
7.044
-1.97
-21.86%
jan 1, 1981
8.505
+1.461
20.74%
jan 1, 1982
10.446
+1.942
22.83%
jan 1, 1983
10.099
-0.347
-3.32%
jan 1, 1984
7.403
-2.697
-26.7%
jan 1, 1985
5.983
-1.419
-19.17%
jan 1, 1986
4.303
-1.68
-28.08%
jan 1, 1987
2.666
-1.638
-38.05%
jan 1, 1988
4.796
+2.13
79.89%
jan 1, 1989
3.933
-0.863
-17.99%
jan 1, 1990
4.953
+1.02
25.94%
jan 1, 1991
2.834
-2.119
-42.79%
jan 1, 1992
2.675
-0.158
-5.59%
jan 1, 1993
1.678
-0.998
-37.29%
jan 1, 1994
0.665
-1.012
-60.34%
jan 1, 1995
1.533
+0.868
130.49%
jan 1, 1996
1.257
-0.277
-18.04%
jan 1, 1997
2.014
+0.757
60.25%
jan 1, 1998
2.014
0.0
-0.01%
jan 1, 1999
1.232
-0.782
-38.81%
jan 1, 2000
1.685
+0.453
36.72%
jan 1, 2001
3.018
+1.333
79.14%
jan 1, 2002
2.518
-0.5
-16.55%
jan 1, 2003
2.348
-0.171
-6.78%
jan 1, 2004
1.482
-0.866
-36.88%
jan 1, 2005
2.072
+0.59
39.83%
jan 1, 2006
2.895
+0.823
39.71%
jan 1, 2007
2.182
-0.712
-24.61%
jan 1, 2008
2.516
+0.333
15.26%
jan 1, 2009
4.098
+1.583
62.92%
jan 1, 2010
0.476
-3.622
-88.38%
jan 1, 2011
3.248
+2.771
581.94%
jan 1, 2012
0.771
-2.476
-76.25%
jan 1, 2013
2.76
+1.989
257.86%
jan 1, 2014
1.357
-1.403
-50.83%
jan 1, 2015
0.78
-0.577
-42.49%
jan 1, 2016
1.201
+0.421
53.94%
Ranking of countries by current statistics by years


Comments: