29
/
en
AIzaSyAYiBZKx7MnpbEhh9jyipgxe19OcubqV5w
April 1, 2024
262401
Thailand
THA
true
2
1
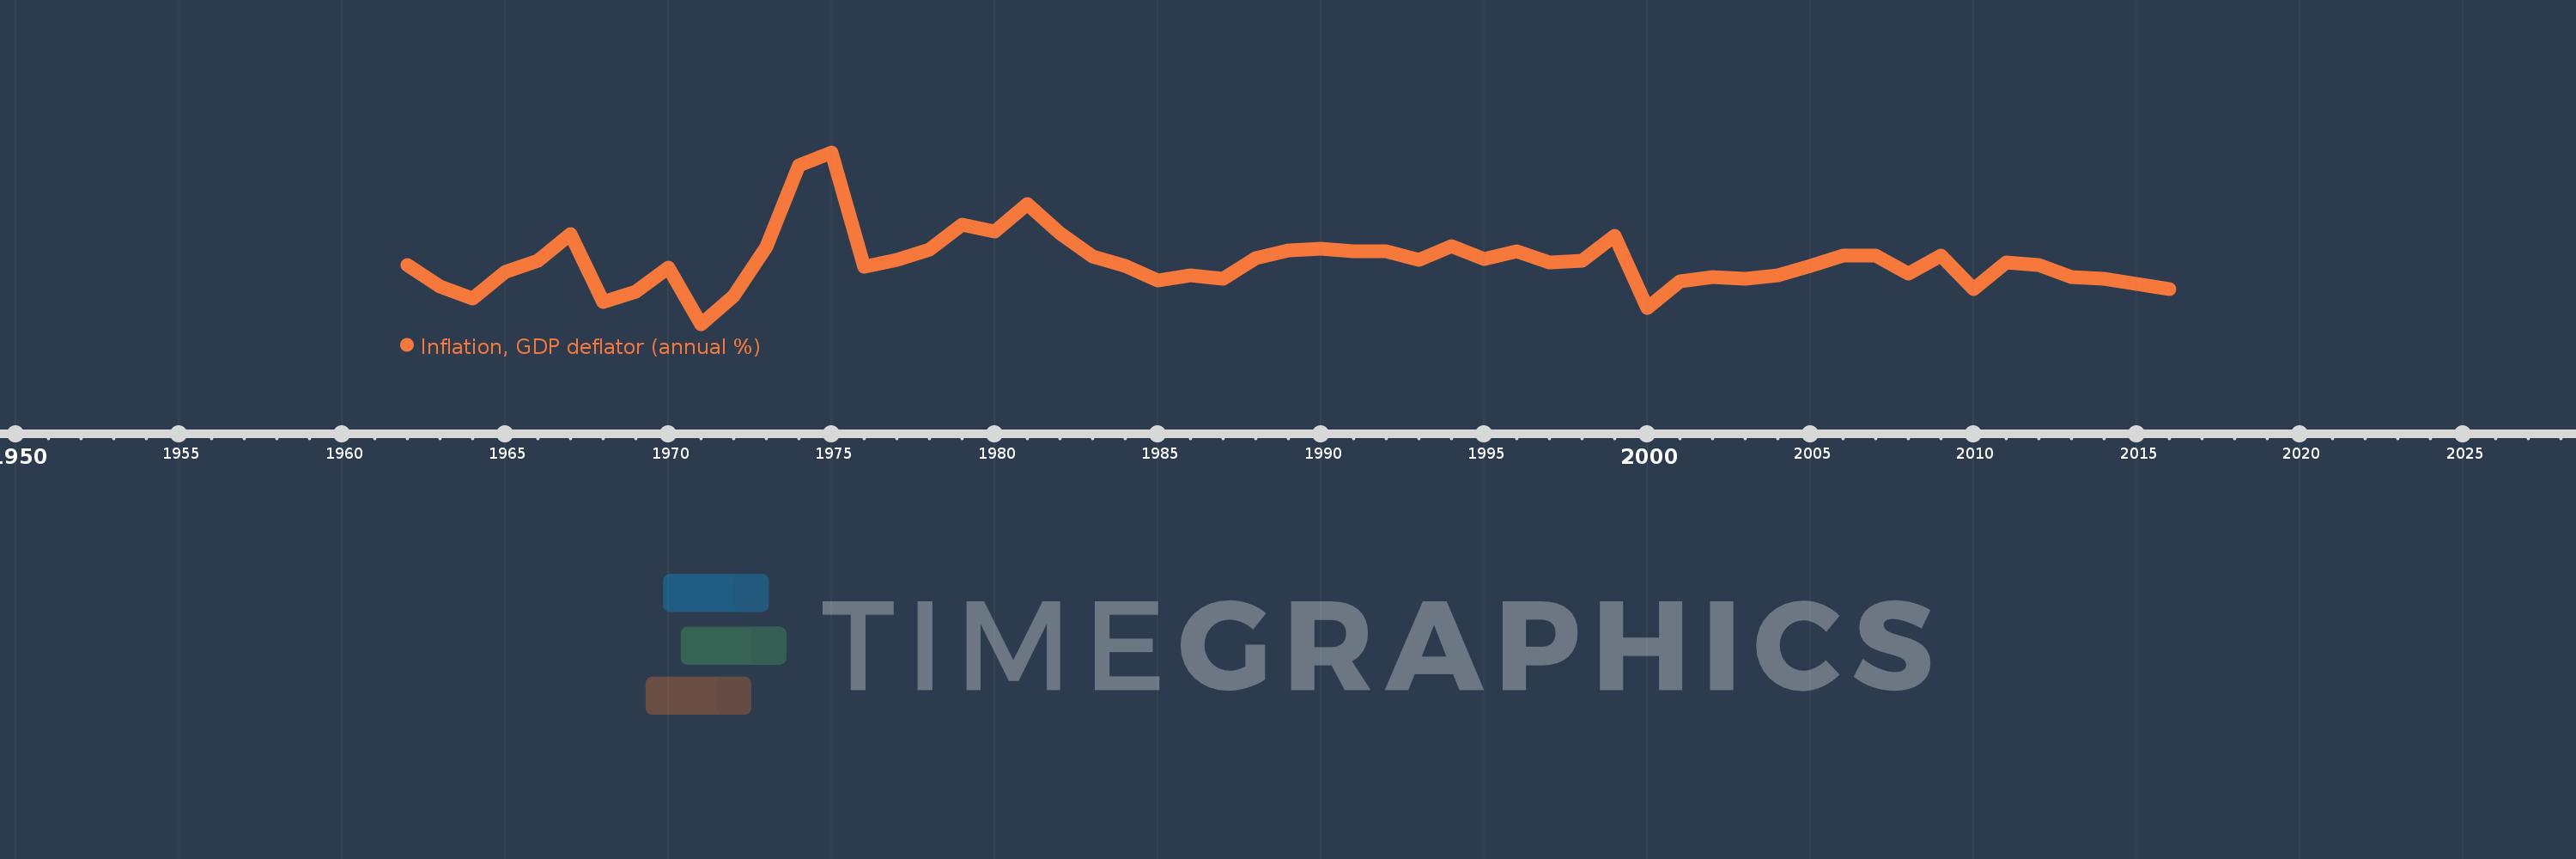
Inflation, GDP deflator (annual %)
2016,2015,2014,2013,2012,2011,2010,2009,2008,2007,2006,2005,2004,2003,2002,2001,2000,1999,1998,1997,1996,1995,1994,1993,1992,1991,1990,1989,1988,1987,1986,1985,1984,1983,1982,1981,1980,1979,1978,1977,1976,1975,1974,1973,1972,1971,1970,1969,1968,1967,1966,1965,1964,1963,1962
This statistics in other country:
AfghanistanAlbaniaAlgeriaAndorraAngolaAntigua and BarbudaArab WorldArgentinaArmeniaArubaAustraliaAustriaAzerbaijanBahamas, TheBahrainBangladeshBarbadosBelarusBelgiumBelizeBeninBermudaBhutanBoliviaBosnia and HerzegovinaBotswanaBrazilBrunei DarussalamBulgariaBurkina FasoBurundiCabo VerdeCambodiaCameroonCanadaCaribbean small statesCayman IslandsCentral African RepublicCentral Europe and the BalticsChadChannel IslandsChileChinaColombiaComorosCongo, Dem. Rep.Congo, Rep.Costa RicaCote d'IvoireCroatiaCubaCyprusCzech RepublicDenmarkDjiboutiDominicaDominican RepublicEarly-demographic dividendEast Asia & PacificEast Asia & Pacific (excluding high income)East Asia & Pacific (IDA & IBRD countries)EcuadorEgypt, Arab Rep.El SalvadorEquatorial GuineaEritreaEstoniaEthiopiaEuro areaEurope & Central AsiaEurope & Central Asia (excluding high income)Europe & Central Asia (IDA & IBRD countries)European UnionFijiFinlandFragile and conflict affected situationsFranceFrench PolynesiaGabonGambia, TheGeorgiaGermanyGhanaGreeceGreenlandGrenadaGuatemalaGuineaGuinea-BissauGuyanaHaitiHeavily indebted poor countries (HIPC)High incomeHondurasHong Kong SAR, ChinaHungaryIBRD onlyIcelandIDA & IBRD totalIDA blendIDA onlyIDA totalIndiaIndonesiaIran, Islamic Rep.IraqIrelandIsle of ManIsraelItalyJamaicaJapanJordanKazakhstanKenyaKiribatiKorea, Rep.KosovoKuwaitKyrgyz RepublicLao PDRLate-demographic dividendLatin America & Caribbean Latin America & Caribbean (excluding high income)Latin America & the Caribbean (IDA & IBRD countries)LatviaLeast developed countries: UN classificationLebanonLesothoLiberiaLibyaLiechtensteinLithuaniaLow & middle incomeLow incomeLower middle incomeLuxembourgMacao SAR, ChinaMacedonia, FYRMadagascarMalawiMalaysiaMaldivesMaliMaltaMarshall IslandsMauritaniaMauritiusMexicoMicronesia, Fed. Sts.Middle East & North AfricaMiddle East & North Africa (excluding high income)Middle East & North Africa (IDA & IBRD countries)Middle incomeMoldovaMonacoMongoliaMontenegroMoroccoMozambiqueMyanmarNamibiaNauruNepalNetherlandsNew CaledoniaNew ZealandNicaraguaNigerNigeriaNorth AmericaNorwayOECD membersOmanOther small statesPacific island small statesPakistanPalauPanamaPapua New GuineaParaguayPeruPhilippinesPolandPortugalPost-demographic dividendPre-demographic dividendPuerto RicoQatarRomaniaRussian FederationRwandaSamoaSan MarinoSao Tome and PrincipeSaudi ArabiaSenegalSerbiaSeychellesSierra LeoneSingaporeSlovak RepublicSloveniaSmall statesSolomon IslandsSomaliaSouth AfricaSouth AsiaSouth Asia (IDA & IBRD)South SudanSpainSri LankaSt. Kitts and NevisSt. LuciaSt. Vincent and the GrenadinesSub-Saharan Africa Sub-Saharan Africa (excluding high income)Sub-Saharan Africa (IDA & IBRD countries)SudanSurinameSwazilandSwedenSwitzerlandSyrian Arab RepublicTajikistanTanzaniaThailandTimor-LesteTogoTongaTrinidad and TobagoTunisiaTurkeyTurkmenistanTuvaluUgandaUkraineUnited Arab EmiratesUnited KingdomUnited StatesUpper middle incomeUruguayUzbekistanVanuatuVenezuela, RBVietnamVirgin Islands (U.S.)West Bank and GazaWorldYemen, Rep.ZambiaZimbabwe Timeline:
This timeline shows a graph from 1962 to 2016 of Thailand. No data until 1961. Number of actual observations by date: 55.
Source name:
World Development Indicators
Source organization:
World Bank national accounts data, and OECD National Accounts data files.
Categories, topics:
Economy & Growth
Last updated:
apr 23, 2017
Indicators value changes by year
Minimum:
-4.995
jan 1, 1971
Maximum:
20.335
jan 1, 1975
At the date of observation
Value
Absolute change
Change from previous value
jan 1, 1962
3.699
+3.699
0.0%
jan 1, 1963
0.54
-3.158
-85.39%
jan 1, 1964
-1.167
-1.707
-315.86%
jan 1, 1965
2.678
+3.845
-329.51%
jan 1, 1966
4.317
+1.639
61.2%
jan 1, 1967
8.245
+3.929
91.02%
jan 1, 1968
-1.668
-9.913
-120.23%
jan 1, 1969
-0.253
+1.415
-84.83%
jan 1, 1970
3.333
+3.586
-1.42K%
jan 1, 1971
-4.995
-8.329
-249.85%
jan 1, 1972
-0.786
+4.209
-84.26%
jan 1, 1973
6.337
+7.123
-905.89%
jan 1, 1974
18.446
+12.109
191.08%
jan 1, 1975
20.335
+1.889
10.24%
jan 1, 1976
3.488
-16.847
-82.85%
jan 1, 1977
4.497
+1.009
28.93%
jan 1, 1978
6.015
+1.518
33.75%
jan 1, 1979
9.697
+3.682
61.22%
jan 1, 1980
8.646
-1.052
-10.84%
jan 1, 1981
12.702
+4.057
46.92%
jan 1, 1982
8.372
-4.33
-34.09%
jan 1, 1983
5.058
-3.315
-39.59%
jan 1, 1984
3.649
-1.409
-27.85%
jan 1, 1985
1.448
-2.201
-60.32%
jan 1, 1986
2.177
+0.729
50.37%
jan 1, 1987
1.653
-0.524
-24.07%
jan 1, 1988
4.723
+3.07
185.71%
jan 1, 1989
5.918
+1.195
25.3%
jan 1, 1990
6.117
+0.198
3.35%
jan 1, 1991
5.773
-0.344
-5.62%
jan 1, 1992
5.747
-0.027
-0.46%
jan 1, 1993
4.49
-1.256
-21.86%
jan 1, 1994
6.492
+2.001
44.57%
jan 1, 1995
4.672
-1.819
-28.03%
jan 1, 1996
5.74
+1.068
22.85%
jan 1, 1997
4.098
-1.642
-28.61%
jan 1, 1998
4.421
+0.323
7.88%
jan 1, 1999
8.064
+3.643
82.4%
jan 1, 2000
-2.577
-10.641
-131.96%
jan 1, 2001
1.331
+3.908
-151.64%
jan 1, 2002
1.918
+0.587
44.1%
jan 1, 2003
1.69
-0.227
-11.85%
jan 1, 2004
2.149
+0.459
27.16%
jan 1, 2005
3.569
+1.42
66.05%
jan 1, 2006
5.091
+1.522
42.65%
jan 1, 2007
5.104
+0.013
0.25%
jan 1, 2008
2.473
-2.631
-51.54%
jan 1, 2009
5.134
+2.66
107.57%
jan 1, 2010
0.195
-4.939
-96.21%
jan 1, 2011
4.082
+3.888
2.0K%
jan 1, 2012
3.746
-0.336
-8.24%
jan 1, 2013
1.91
-1.836
-49.02%
jan 1, 2014
1.725
-0.185
-9.67%
jan 1, 2015
0.963
-0.762
-44.18%
jan 1, 2016
0.222
-0.741
-76.98%
Ranking of countries by current statistics by years


Comments: