29
/
en
AIzaSyAYiBZKx7MnpbEhh9jyipgxe19OcubqV5w
April 1, 2024
245745
South Africa
ZAF
true
2
1
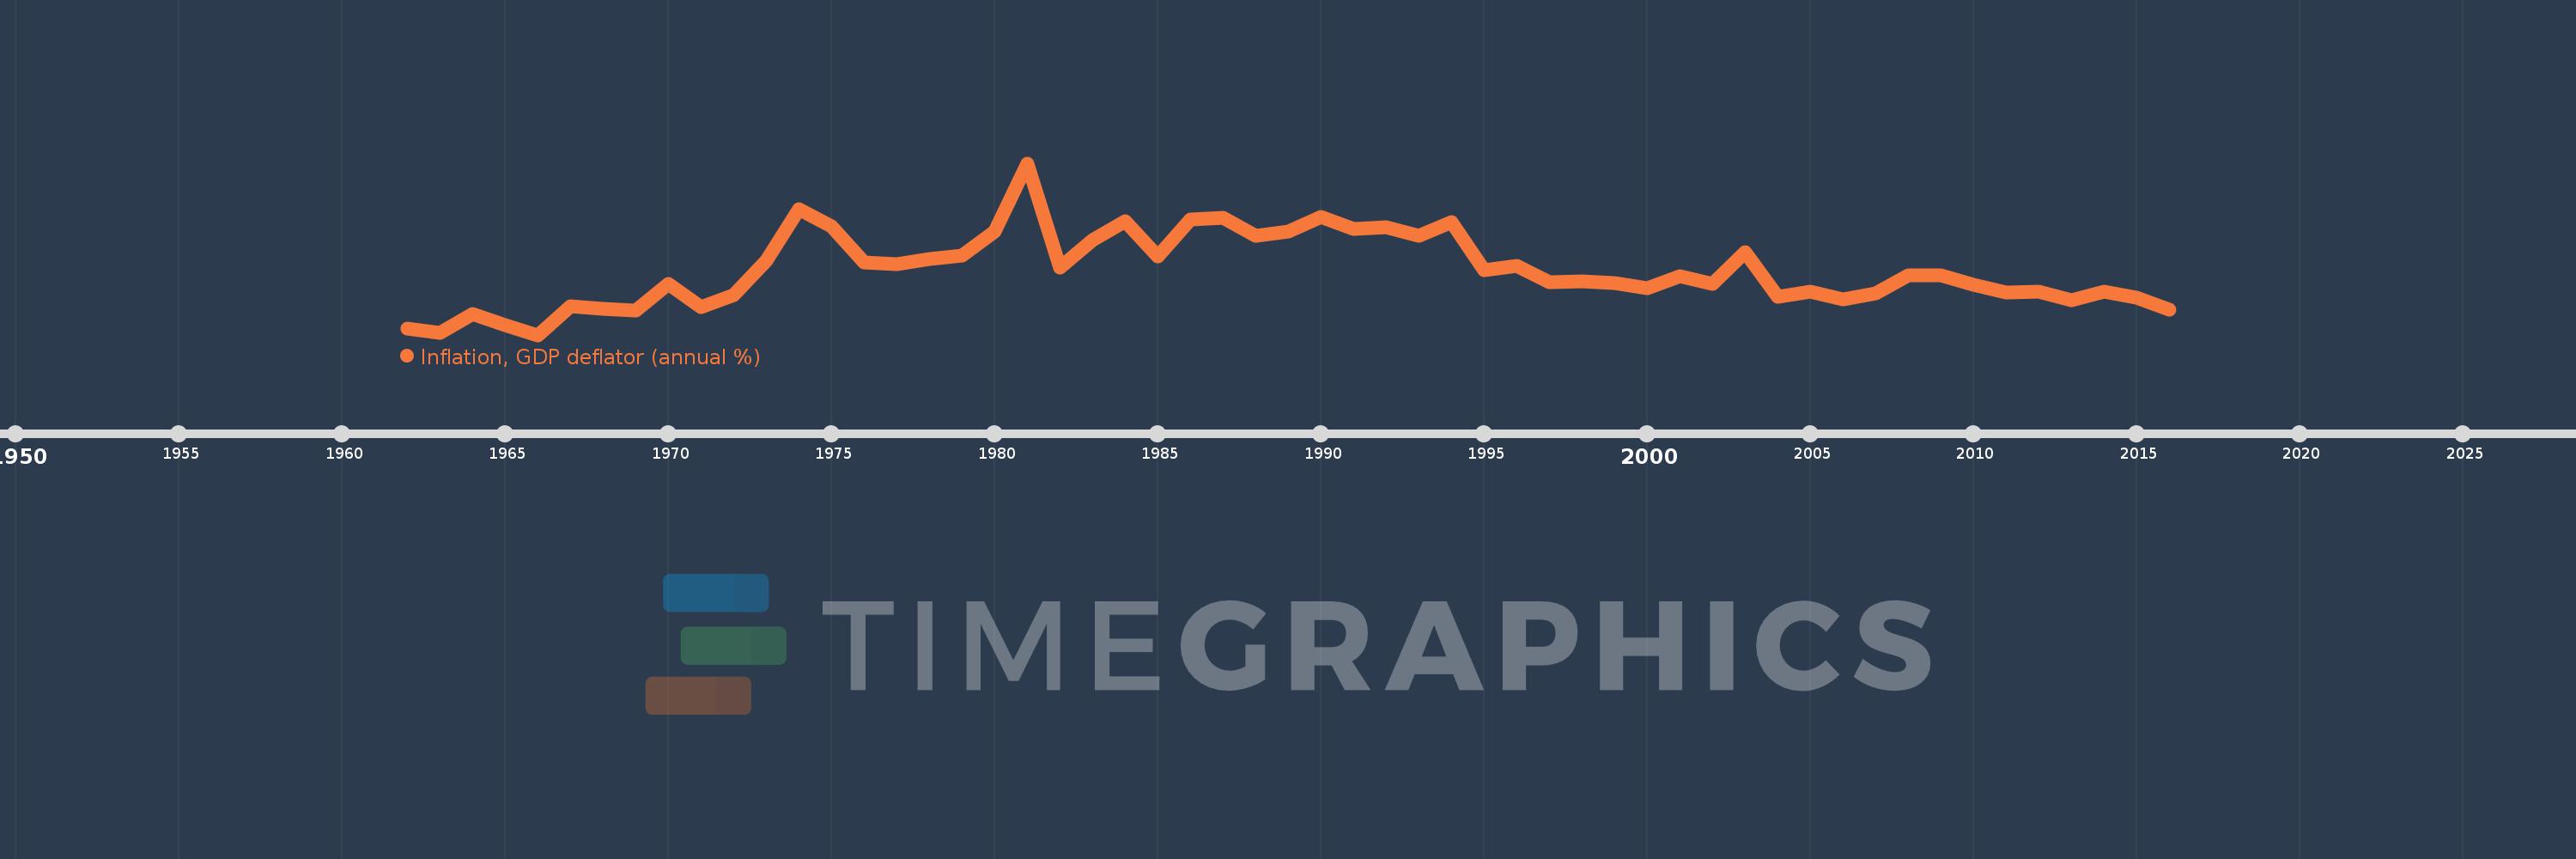
Inflation, GDP deflator (annual %)
2016,2015,2014,2013,2012,2011,2010,2009,2008,2007,2006,2005,2004,2003,2002,2001,2000,1999,1998,1997,1996,1995,1994,1993,1992,1991,1990,1989,1988,1987,1986,1985,1984,1983,1982,1981,1980,1979,1978,1977,1976,1975,1974,1973,1972,1971,1970,1969,1968,1967,1966,1965,1964,1963,1962
This statistics in other country:
AfghanistanAlbaniaAlgeriaAndorraAngolaAntigua and BarbudaArab WorldArgentinaArmeniaArubaAustraliaAustriaAzerbaijanBahamas, TheBahrainBangladeshBarbadosBelarusBelgiumBelizeBeninBermudaBhutanBoliviaBosnia and HerzegovinaBotswanaBrazilBrunei DarussalamBulgariaBurkina FasoBurundiCabo VerdeCambodiaCameroonCanadaCaribbean small statesCayman IslandsCentral African RepublicCentral Europe and the BalticsChadChannel IslandsChileChinaColombiaComorosCongo, Dem. Rep.Congo, Rep.Costa RicaCote d'IvoireCroatiaCubaCyprusCzech RepublicDenmarkDjiboutiDominicaDominican RepublicEarly-demographic dividendEast Asia & PacificEast Asia & Pacific (excluding high income)East Asia & Pacific (IDA & IBRD countries)EcuadorEgypt, Arab Rep.El SalvadorEquatorial GuineaEritreaEstoniaEthiopiaEuro areaEurope & Central AsiaEurope & Central Asia (excluding high income)Europe & Central Asia (IDA & IBRD countries)European UnionFijiFinlandFragile and conflict affected situationsFranceFrench PolynesiaGabonGambia, TheGeorgiaGermanyGhanaGreeceGreenlandGrenadaGuatemalaGuineaGuinea-BissauGuyanaHaitiHeavily indebted poor countries (HIPC)High incomeHondurasHong Kong SAR, ChinaHungaryIBRD onlyIcelandIDA & IBRD totalIDA blendIDA onlyIDA totalIndiaIndonesiaIran, Islamic Rep.IraqIrelandIsle of ManIsraelItalyJamaicaJapanJordanKazakhstanKenyaKiribatiKorea, Rep.KosovoKuwaitKyrgyz RepublicLao PDRLate-demographic dividendLatin America & Caribbean Latin America & Caribbean (excluding high income)Latin America & the Caribbean (IDA & IBRD countries)LatviaLeast developed countries: UN classificationLebanonLesothoLiberiaLibyaLiechtensteinLithuaniaLow & middle incomeLow incomeLower middle incomeLuxembourgMacao SAR, ChinaMacedonia, FYRMadagascarMalawiMalaysiaMaldivesMaliMaltaMarshall IslandsMauritaniaMauritiusMexicoMicronesia, Fed. Sts.Middle East & North AfricaMiddle East & North Africa (excluding high income)Middle East & North Africa (IDA & IBRD countries)Middle incomeMoldovaMonacoMongoliaMontenegroMoroccoMozambiqueMyanmarNamibiaNauruNepalNetherlandsNew CaledoniaNew ZealandNicaraguaNigerNigeriaNorth AmericaNorwayOECD membersOmanOther small statesPacific island small statesPakistanPalauPanamaPapua New GuineaParaguayPeruPhilippinesPolandPortugalPost-demographic dividendPre-demographic dividendPuerto RicoQatarRomaniaRussian FederationRwandaSamoaSan MarinoSao Tome and PrincipeSaudi ArabiaSenegalSerbiaSeychellesSierra LeoneSingaporeSlovak RepublicSloveniaSmall statesSolomon IslandsSomaliaSouth AfricaSouth AsiaSouth Asia (IDA & IBRD)South SudanSpainSri LankaSt. Kitts and NevisSt. LuciaSt. Vincent and the GrenadinesSub-Saharan Africa Sub-Saharan Africa (excluding high income)Sub-Saharan Africa (IDA & IBRD countries)SudanSurinameSwazilandSwedenSwitzerlandSyrian Arab RepublicTajikistanTanzaniaThailandTimor-LesteTogoTongaTrinidad and TobagoTunisiaTurkeyTurkmenistanTuvaluUgandaUkraineUnited Arab EmiratesUnited KingdomUnited StatesUpper middle incomeUruguayUzbekistanVanuatuVenezuela, RBVietnamVirgin Islands (U.S.)West Bank and GazaWorldYemen, Rep.ZambiaZimbabwe Timeline:
This timeline shows a graph from 1962 to 2016 of South Africa. No data until 1961. Number of actual observations by date: 55.
Source name:
World Development Indicators
Source organization:
World Bank national accounts data, and OECD National Accounts data files.
Categories, topics:
Economy & Growth
Last updated:
apr 23, 2017
Indicators value changes by year
Maximum:
24.915
jan 1, 1981
At the date of observation
Value
Absolute change
Change from previous value
jan 1, 1962
1.261
+1.261
0.0%
jan 1, 1963
0.593
-0.667
-52.94%
jan 1, 1964
3.327
+2.733
460.67%
jan 1, 1965
1.697
-1.629
-48.98%
jan 1, 1966
0.319
-1.379
-81.21%
jan 1, 1967
4.388
+4.069
1.28K%
jan 1, 1968
4.076
-0.312
-7.11%
jan 1, 1969
3.857
-0.22
-5.39%
jan 1, 1970
7.632
+3.775
97.89%
jan 1, 1971
4.283
-3.349
-43.88%
jan 1, 1972
5.98
+1.697
39.63%
jan 1, 1973
11.017
+5.036
84.21%
jan 1, 1974
18.328
+7.312
66.37%
jan 1, 1975
15.901
-2.427
-13.24%
jan 1, 1976
10.671
-5.23
-32.89%
jan 1, 1977
10.417
-0.254
-2.38%
jan 1, 1978
11.169
+0.752
7.22%
jan 1, 1979
11.68
+0.511
4.58%
jan 1, 1980
15.131
+3.451
29.55%
jan 1, 1981
24.915
+9.784
64.66%
jan 1, 1982
9.927
-14.987
-60.15%
jan 1, 1983
13.936
+4.009
40.38%
jan 1, 1984
16.569
+2.632
18.89%
jan 1, 1985
11.52
-5.049
-30.47%
jan 1, 1986
16.801
+5.281
45.84%
jan 1, 1987
17.062
+0.261
1.55%
jan 1, 1988
14.498
-2.564
-15.03%
jan 1, 1989
15.183
+0.686
4.73%
jan 1, 1990
17.259
+2.076
13.67%
jan 1, 1991
15.522
-1.737
-10.07%
jan 1, 1992
15.727
+0.206
1.32%
jan 1, 1993
14.571
-1.156
-7.35%
jan 1, 1994
16.471
+1.9
13.04%
jan 1, 1995
9.561
-6.911
-41.95%
jan 1, 1996
10.213
+0.653
6.83%
jan 1, 1997
7.906
-2.308
-22.59%
jan 1, 1998
7.987
+0.081
1.03%
jan 1, 1999
7.787
-0.2
-2.5%
jan 1, 2000
7.028
-0.76
-9.75%
jan 1, 2001
8.796
+1.768
25.16%
jan 1, 2002
7.642
-1.155
-13.13%
jan 1, 2003
12.205
+4.564
59.72%
jan 1, 2004
5.794
-6.412
-52.53%
jan 1, 2005
6.527
+0.734
12.66%
jan 1, 2006
5.449
-1.078
-16.52%
jan 1, 2007
6.274
+0.825
15.14%
jan 1, 2008
8.849
+2.575
41.04%
jan 1, 2009
8.832
-0.018
-0.2%
jan 1, 2010
7.505
-1.327
-15.03%
jan 1, 2011
6.351
-1.153
-15.37%
jan 1, 2012
6.532
+0.181
2.85%
jan 1, 2013
5.287
-1.246
-19.07%
jan 1, 2014
6.588
+1.301
24.61%
jan 1, 2015
5.701
-0.886
-13.45%
jan 1, 2016
3.957
-1.744
-30.6%
Ranking of countries by current statistics by years


Comments: