29
/
en
AIzaSyAYiBZKx7MnpbEhh9jyipgxe19OcubqV5w
April 1, 2024
66150
Algeria
DZA
true
2
1
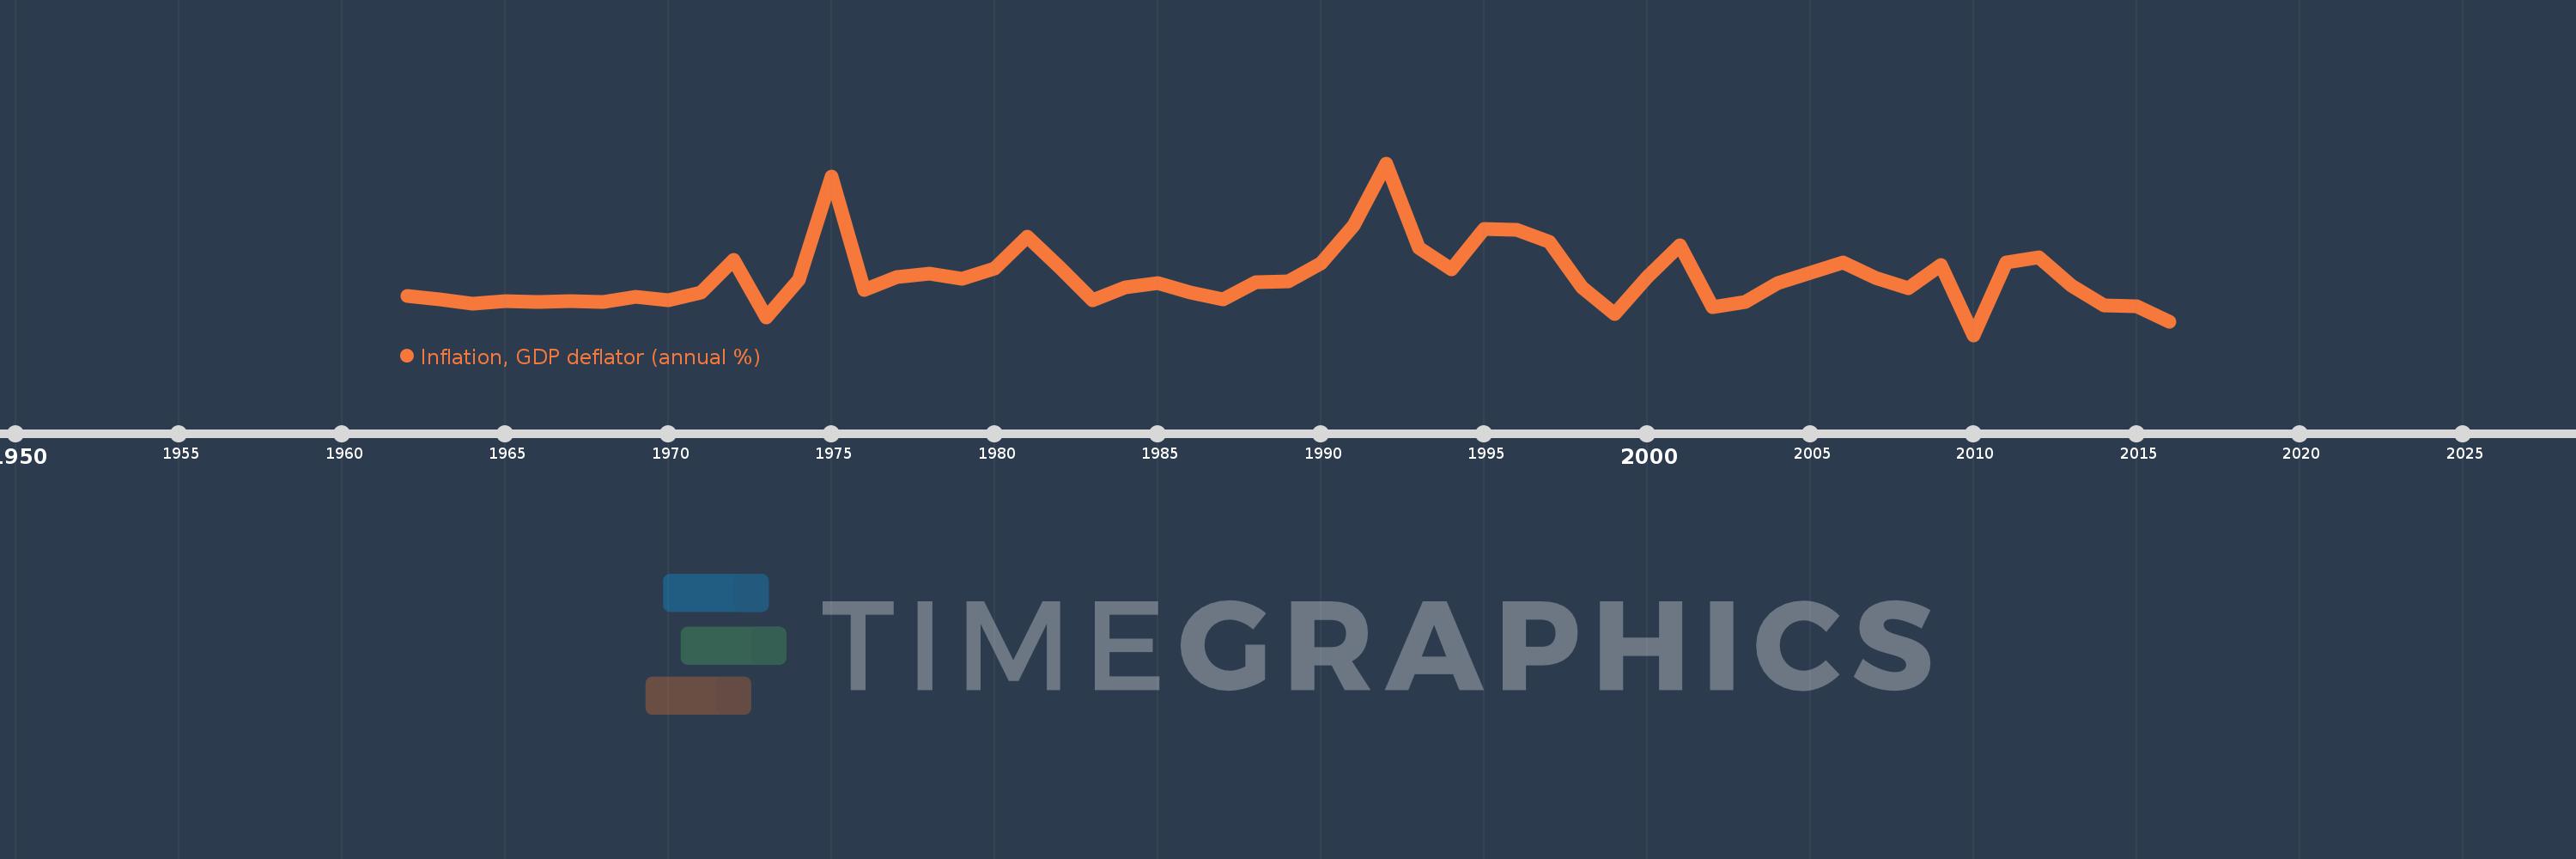
Inflation, GDP deflator (annual %)
2016,2015,2014,2013,2012,2011,2010,2009,2008,2007,2006,2005,2004,2003,2002,2001,2000,1999,1998,1997,1996,1995,1994,1993,1992,1991,1990,1989,1988,1987,1986,1985,1984,1983,1982,1981,1980,1979,1978,1977,1976,1975,1974,1973,1972,1971,1970,1969,1968,1967,1966,1965,1964,1963,1962
This statistics in other country:
AfghanistanAlbaniaAlgeriaAndorraAngolaAntigua and BarbudaArab WorldArgentinaArmeniaArubaAustraliaAustriaAzerbaijanBahamas, TheBahrainBangladeshBarbadosBelarusBelgiumBelizeBeninBermudaBhutanBoliviaBosnia and HerzegovinaBotswanaBrazilBrunei DarussalamBulgariaBurkina FasoBurundiCabo VerdeCambodiaCameroonCanadaCaribbean small statesCayman IslandsCentral African RepublicCentral Europe and the BalticsChadChannel IslandsChileChinaColombiaComorosCongo, Dem. Rep.Congo, Rep.Costa RicaCote d'IvoireCroatiaCubaCyprusCzech RepublicDenmarkDjiboutiDominicaDominican RepublicEarly-demographic dividendEast Asia & PacificEast Asia & Pacific (excluding high income)East Asia & Pacific (IDA & IBRD countries)EcuadorEgypt, Arab Rep.El SalvadorEquatorial GuineaEritreaEstoniaEthiopiaEuro areaEurope & Central AsiaEurope & Central Asia (excluding high income)Europe & Central Asia (IDA & IBRD countries)European UnionFijiFinlandFragile and conflict affected situationsFranceFrench PolynesiaGabonGambia, TheGeorgiaGermanyGhanaGreeceGreenlandGrenadaGuatemalaGuineaGuinea-BissauGuyanaHaitiHeavily indebted poor countries (HIPC)High incomeHondurasHong Kong SAR, ChinaHungaryIBRD onlyIcelandIDA & IBRD totalIDA blendIDA onlyIDA totalIndiaIndonesiaIran, Islamic Rep.IraqIrelandIsle of ManIsraelItalyJamaicaJapanJordanKazakhstanKenyaKiribatiKorea, Rep.KosovoKuwaitKyrgyz RepublicLao PDRLate-demographic dividendLatin America & Caribbean Latin America & Caribbean (excluding high income)Latin America & the Caribbean (IDA & IBRD countries)LatviaLeast developed countries: UN classificationLebanonLesothoLiberiaLibyaLiechtensteinLithuaniaLow & middle incomeLow incomeLower middle incomeLuxembourgMacao SAR, ChinaMacedonia, FYRMadagascarMalawiMalaysiaMaldivesMaliMaltaMarshall IslandsMauritaniaMauritiusMexicoMicronesia, Fed. Sts.Middle East & North AfricaMiddle East & North Africa (excluding high income)Middle East & North Africa (IDA & IBRD countries)Middle incomeMoldovaMonacoMongoliaMontenegroMoroccoMozambiqueMyanmarNamibiaNauruNepalNetherlandsNew CaledoniaNew ZealandNicaraguaNigerNigeriaNorth AmericaNorwayOECD membersOmanOther small statesPacific island small statesPakistanPalauPanamaPapua New GuineaParaguayPeruPhilippinesPolandPortugalPost-demographic dividendPre-demographic dividendPuerto RicoQatarRomaniaRussian FederationRwandaSamoaSan MarinoSao Tome and PrincipeSaudi ArabiaSenegalSerbiaSeychellesSierra LeoneSingaporeSlovak RepublicSloveniaSmall statesSolomon IslandsSomaliaSouth AfricaSouth AsiaSouth Asia (IDA & IBRD)South SudanSpainSri LankaSt. Kitts and NevisSt. LuciaSt. Vincent and the GrenadinesSub-Saharan Africa Sub-Saharan Africa (excluding high income)Sub-Saharan Africa (IDA & IBRD countries)SudanSurinameSwazilandSwedenSwitzerlandSyrian Arab RepublicTajikistanTanzaniaThailandTimor-LesteTogoTongaTrinidad and TobagoTunisiaTurkeyTurkmenistanTuvaluUgandaUkraineUnited Arab EmiratesUnited KingdomUnited StatesUpper middle incomeUruguayUzbekistanVanuatuVenezuela, RBVietnamVirgin Islands (U.S.)West Bank and GazaWorldYemen, Rep.ZambiaZimbabwe Timeline:
This timeline shows a graph from 1962 to 2016 of Algeria. No data until 1961. Number of actual observations by date: 55.
Source name:
World Development Indicators
Source organization:
World Bank national accounts data, and OECD National Accounts data files.
Categories, topics:
Economy & Growth
Last updated:
apr 23, 2017
Indicators value changes by year
Minimum:
-11.162
jan 1, 2010
Maximum:
53.789
jan 1, 1992
At the date of observation
Value
Absolute change
Change from previous value
jan 1, 1962
3.472
+3.472
0.0%
jan 1, 1963
2.351
-1.12
-32.27%
jan 1, 1964
0.549
-1.802
-76.64%
jan 1, 1965
1.695
+1.146
208.59%
jan 1, 1966
1.501
-0.194
-11.44%
jan 1, 1967
1.818
+0.316
21.08%
jan 1, 1968
1.312
-0.506
-27.82%
jan 1, 1969
3.142
+1.83
139.48%
jan 1, 1970
1.921
-1.221
-38.86%
jan 1, 1971
4.94
+3.019
157.17%
jan 1, 1972
17.152
+12.212
247.17%
jan 1, 1973
-4.606
-21.758
-126.86%
jan 1, 1974
9.628
+14.234
-309.0%
jan 1, 1975
48.897
+39.269
407.88%
jan 1, 1976
5.914
-42.983
-87.91%
jan 1, 1977
10.841
+4.927
83.3%
jan 1, 1978
11.927
+1.087
10.02%
jan 1, 1979
10.085
-1.842
-15.44%
jan 1, 1980
13.988
+3.903
38.7%
jan 1, 1981
25.862
+11.874
84.89%
jan 1, 1982
14.354
-11.508
-44.5%
jan 1, 1983
1.94
-12.414
-86.49%
jan 1, 1984
6.805
+4.865
250.8%
jan 1, 1985
8.434
+1.629
23.93%
jan 1, 1986
4.973
-3.461
-41.04%
jan 1, 1987
2.405
-2.567
-51.63%
jan 1, 1988
8.842
+6.437
267.6%
jan 1, 1989
9.061
+0.219
2.48%
jan 1, 1990
16.011
+6.95
76.71%
jan 1, 1991
30.26
+14.248
88.99%
jan 1, 1992
53.789
+23.529
77.76%
jan 1, 1993
21.926
-31.862
-59.24%
jan 1, 1994
13.624
-8.302
-37.86%
jan 1, 1995
29.078
+15.453
113.42%
jan 1, 1996
28.577
-0.501
-1.72%
jan 1, 1997
24.022
-4.555
-15.94%
jan 1, 1998
7.002
-17.02
-70.85%
jan 1, 1999
-3.131
-10.133
-144.72%
jan 1, 2000
10.856
+13.987
-446.73%
jan 1, 2001
22.678
+11.821
108.89%
jan 1, 2002
-0.473
-23.151
-102.09%
jan 1, 2003
1.32
+1.793
-379.13%
jan 1, 2004
8.331
+7.01
530.91%
jan 1, 2005
12.248
+3.917
47.02%
jan 1, 2006
16.125
+3.878
31.66%
jan 1, 2007
10.547
-5.579
-34.6%
jan 1, 2008
6.395
-4.151
-39.36%
jan 1, 2009
15.311
+8.915
139.4%
jan 1, 2010
-11.162
-26.472
-172.9%
jan 1, 2011
16.12
+27.282
-244.42%
jan 1, 2012
18.228
+2.108
13.08%
jan 1, 2013
7.452
-10.776
-59.12%
jan 1, 2014
-0.112
-7.565
-101.51%
jan 1, 2015
-0.412
-0.3
267.02%
jan 1, 2016
-6.024
-5.612
1.36K%
Ranking of countries by current statistics by years


Comments: