29
/
en
AIzaSyAYiBZKx7MnpbEhh9jyipgxe19OcubqV5w
April 1, 2024
167651
Kenya
KEN
true
2
1
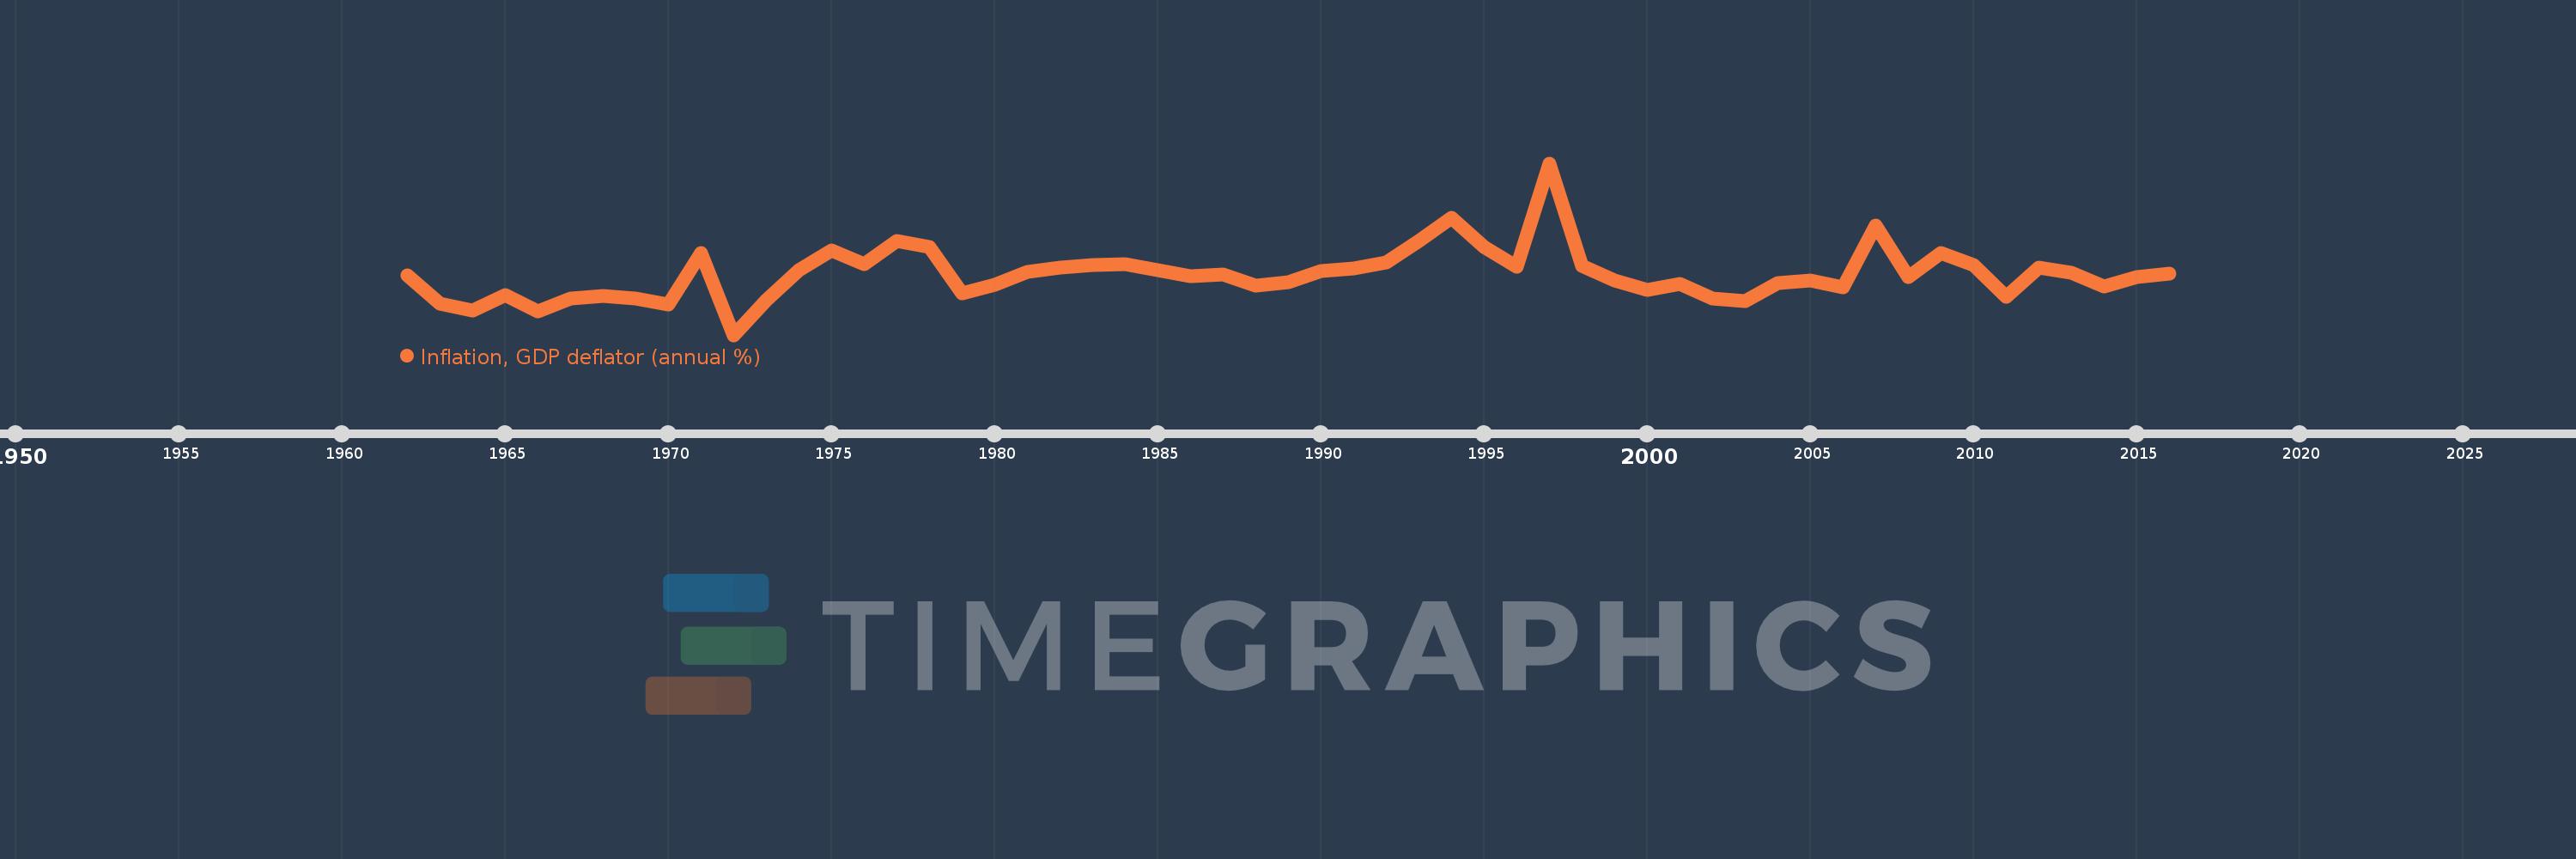
Inflation, GDP deflator (annual %)
2016,2015,2014,2013,2012,2011,2010,2009,2008,2007,2006,2005,2004,2003,2002,2001,2000,1999,1998,1997,1996,1995,1994,1993,1992,1991,1990,1989,1988,1987,1986,1985,1984,1983,1982,1981,1980,1979,1978,1977,1976,1975,1974,1973,1972,1971,1970,1969,1968,1967,1966,1965,1964,1963,1962
This statistics in other country:
AfghanistanAlbaniaAlgeriaAndorraAngolaAntigua and BarbudaArab WorldArgentinaArmeniaArubaAustraliaAustriaAzerbaijanBahamas, TheBahrainBangladeshBarbadosBelarusBelgiumBelizeBeninBermudaBhutanBoliviaBosnia and HerzegovinaBotswanaBrazilBrunei DarussalamBulgariaBurkina FasoBurundiCabo VerdeCambodiaCameroonCanadaCaribbean small statesCayman IslandsCentral African RepublicCentral Europe and the BalticsChadChannel IslandsChileChinaColombiaComorosCongo, Dem. Rep.Congo, Rep.Costa RicaCote d'IvoireCroatiaCubaCyprusCzech RepublicDenmarkDjiboutiDominicaDominican RepublicEarly-demographic dividendEast Asia & PacificEast Asia & Pacific (excluding high income)East Asia & Pacific (IDA & IBRD countries)EcuadorEgypt, Arab Rep.El SalvadorEquatorial GuineaEritreaEstoniaEthiopiaEuro areaEurope & Central AsiaEurope & Central Asia (excluding high income)Europe & Central Asia (IDA & IBRD countries)European UnionFijiFinlandFragile and conflict affected situationsFranceFrench PolynesiaGabonGambia, TheGeorgiaGermanyGhanaGreeceGreenlandGrenadaGuatemalaGuineaGuinea-BissauGuyanaHaitiHeavily indebted poor countries (HIPC)High incomeHondurasHong Kong SAR, ChinaHungaryIBRD onlyIcelandIDA & IBRD totalIDA blendIDA onlyIDA totalIndiaIndonesiaIran, Islamic Rep.IraqIrelandIsle of ManIsraelItalyJamaicaJapanJordanKazakhstanKenyaKiribatiKorea, Rep.KosovoKuwaitKyrgyz RepublicLao PDRLate-demographic dividendLatin America & Caribbean Latin America & Caribbean (excluding high income)Latin America & the Caribbean (IDA & IBRD countries)LatviaLeast developed countries: UN classificationLebanonLesothoLiberiaLibyaLiechtensteinLithuaniaLow & middle incomeLow incomeLower middle incomeLuxembourgMacao SAR, ChinaMacedonia, FYRMadagascarMalawiMalaysiaMaldivesMaliMaltaMarshall IslandsMauritaniaMauritiusMexicoMicronesia, Fed. Sts.Middle East & North AfricaMiddle East & North Africa (excluding high income)Middle East & North Africa (IDA & IBRD countries)Middle incomeMoldovaMonacoMongoliaMontenegroMoroccoMozambiqueMyanmarNamibiaNauruNepalNetherlandsNew CaledoniaNew ZealandNicaraguaNigerNigeriaNorth AmericaNorwayOECD membersOmanOther small statesPacific island small statesPakistanPalauPanamaPapua New GuineaParaguayPeruPhilippinesPolandPortugalPost-demographic dividendPre-demographic dividendPuerto RicoQatarRomaniaRussian FederationRwandaSamoaSan MarinoSao Tome and PrincipeSaudi ArabiaSenegalSerbiaSeychellesSierra LeoneSingaporeSlovak RepublicSloveniaSmall statesSolomon IslandsSomaliaSouth AfricaSouth AsiaSouth Asia (IDA & IBRD)South SudanSpainSri LankaSt. Kitts and NevisSt. LuciaSt. Vincent and the GrenadinesSub-Saharan Africa Sub-Saharan Africa (excluding high income)Sub-Saharan Africa (IDA & IBRD countries)SudanSurinameSwazilandSwedenSwitzerlandSyrian Arab RepublicTajikistanTanzaniaThailandTimor-LesteTogoTongaTrinidad and TobagoTunisiaTurkeyTurkmenistanTuvaluUgandaUkraineUnited Arab EmiratesUnited KingdomUnited StatesUpper middle incomeUruguayUzbekistanVanuatuVenezuela, RBVietnamVirgin Islands (U.S.)West Bank and GazaWorldYemen, Rep.ZambiaZimbabwe Timeline:
This timeline shows a graph from 1962 to 2016 of Kenya. No data until 1961. Number of actual observations by date: 55.
Source name:
World Development Indicators
Source organization:
World Bank national accounts data, and OECD National Accounts data files.
Categories, topics:
Economy & Growth
Last updated:
apr 23, 2017
Indicators value changes by year
Minimum:
-9.219
jan 1, 1972
Maximum:
41.989
jan 1, 1997
At the date of observation
Value
Absolute change
Change from previous value
jan 1, 1962
8.662
+8.662
0.0%
jan 1, 1963
0.018
-8.644
-99.79%
jan 1, 1964
-1.877
-1.896
-10.35K%
jan 1, 1965
2.691
+4.568
-243.33%
jan 1, 1966
-2.052
-4.743
-176.26%
jan 1, 1967
1.714
+3.766
-183.52%
jan 1, 1968
2.401
+0.687
40.09%
jan 1, 1969
1.679
-0.722
-30.07%
jan 1, 1970
-0.18
-1.859
-110.71%
jan 1, 1971
15.316
+15.496
-8.62K%
jan 1, 1972
-9.219
-24.535
-160.19%
jan 1, 1973
1.205
+10.424
-113.07%
jan 1, 1974
10.204
+8.999
746.62%
jan 1, 1975
16.049
+5.845
57.29%
jan 1, 1976
11.835
-4.214
-26.26%
jan 1, 1977
18.906
+7.071
59.75%
jan 1, 1978
16.9
-2.006
-10.61%
jan 1, 1979
3.081
-13.819
-81.77%
jan 1, 1980
5.639
+2.558
83.01%
jan 1, 1981
9.551
+3.912
69.38%
jan 1, 1982
10.853
+1.302
13.64%
jan 1, 1983
11.593
+0.739
6.81%
jan 1, 1984
11.838
+0.245
2.12%
jan 1, 1985
10.191
-1.647
-13.92%
jan 1, 1986
8.306
-1.885
-18.5%
jan 1, 1987
8.712
+0.406
4.89%
jan 1, 1988
5.402
-3.31
-37.99%
jan 1, 1989
6.456
+1.054
19.51%
jan 1, 1990
9.769
+3.313
51.33%
jan 1, 1991
10.637
+0.868
8.89%
jan 1, 1992
12.532
+1.895
17.81%
jan 1, 1993
18.897
+6.365
50.79%
jan 1, 1994
25.698
+6.801
35.99%
jan 1, 1995
17.016
-8.682
-33.78%
jan 1, 1996
11.221
-5.795
-34.06%
jan 1, 1997
41.989
+30.768
274.2%
jan 1, 1998
11.435
-30.554
-72.77%
jan 1, 1999
6.931
-4.504
-39.39%
jan 1, 2000
4.194
-2.737
-39.49%
jan 1, 2001
6.08
+1.886
44.97%
jan 1, 2002
1.573
-4.507
-74.13%
jan 1, 2003
0.933
-0.64
-40.68%
jan 1, 2004
6.197
+5.264
564.09%
jan 1, 2005
7.127
+0.93
15.0%
jan 1, 2006
4.9
-2.227
-31.25%
jan 1, 2007
23.53
+18.63
380.24%
jan 1, 2008
8.129
-15.401
-65.45%
jan 1, 2009
15.151
+7.022
86.37%
jan 1, 2010
11.637
-3.514
-23.19%
jan 1, 2011
2.094
-9.544
-82.01%
jan 1, 2012
10.792
+8.698
415.41%
jan 1, 2013
9.383
-1.409
-13.05%
jan 1, 2014
5.366
-4.017
-42.81%
jan 1, 2015
7.994
+2.628
48.97%
jan 1, 2016
9.143
+1.149
14.37%
Ranking of countries by current statistics by years


Comments: