29
/
en
AIzaSyAYiBZKx7MnpbEhh9jyipgxe19OcubqV5w
April 1, 2024
124947
Egypt, Arab Rep.
EGY
true
2
1
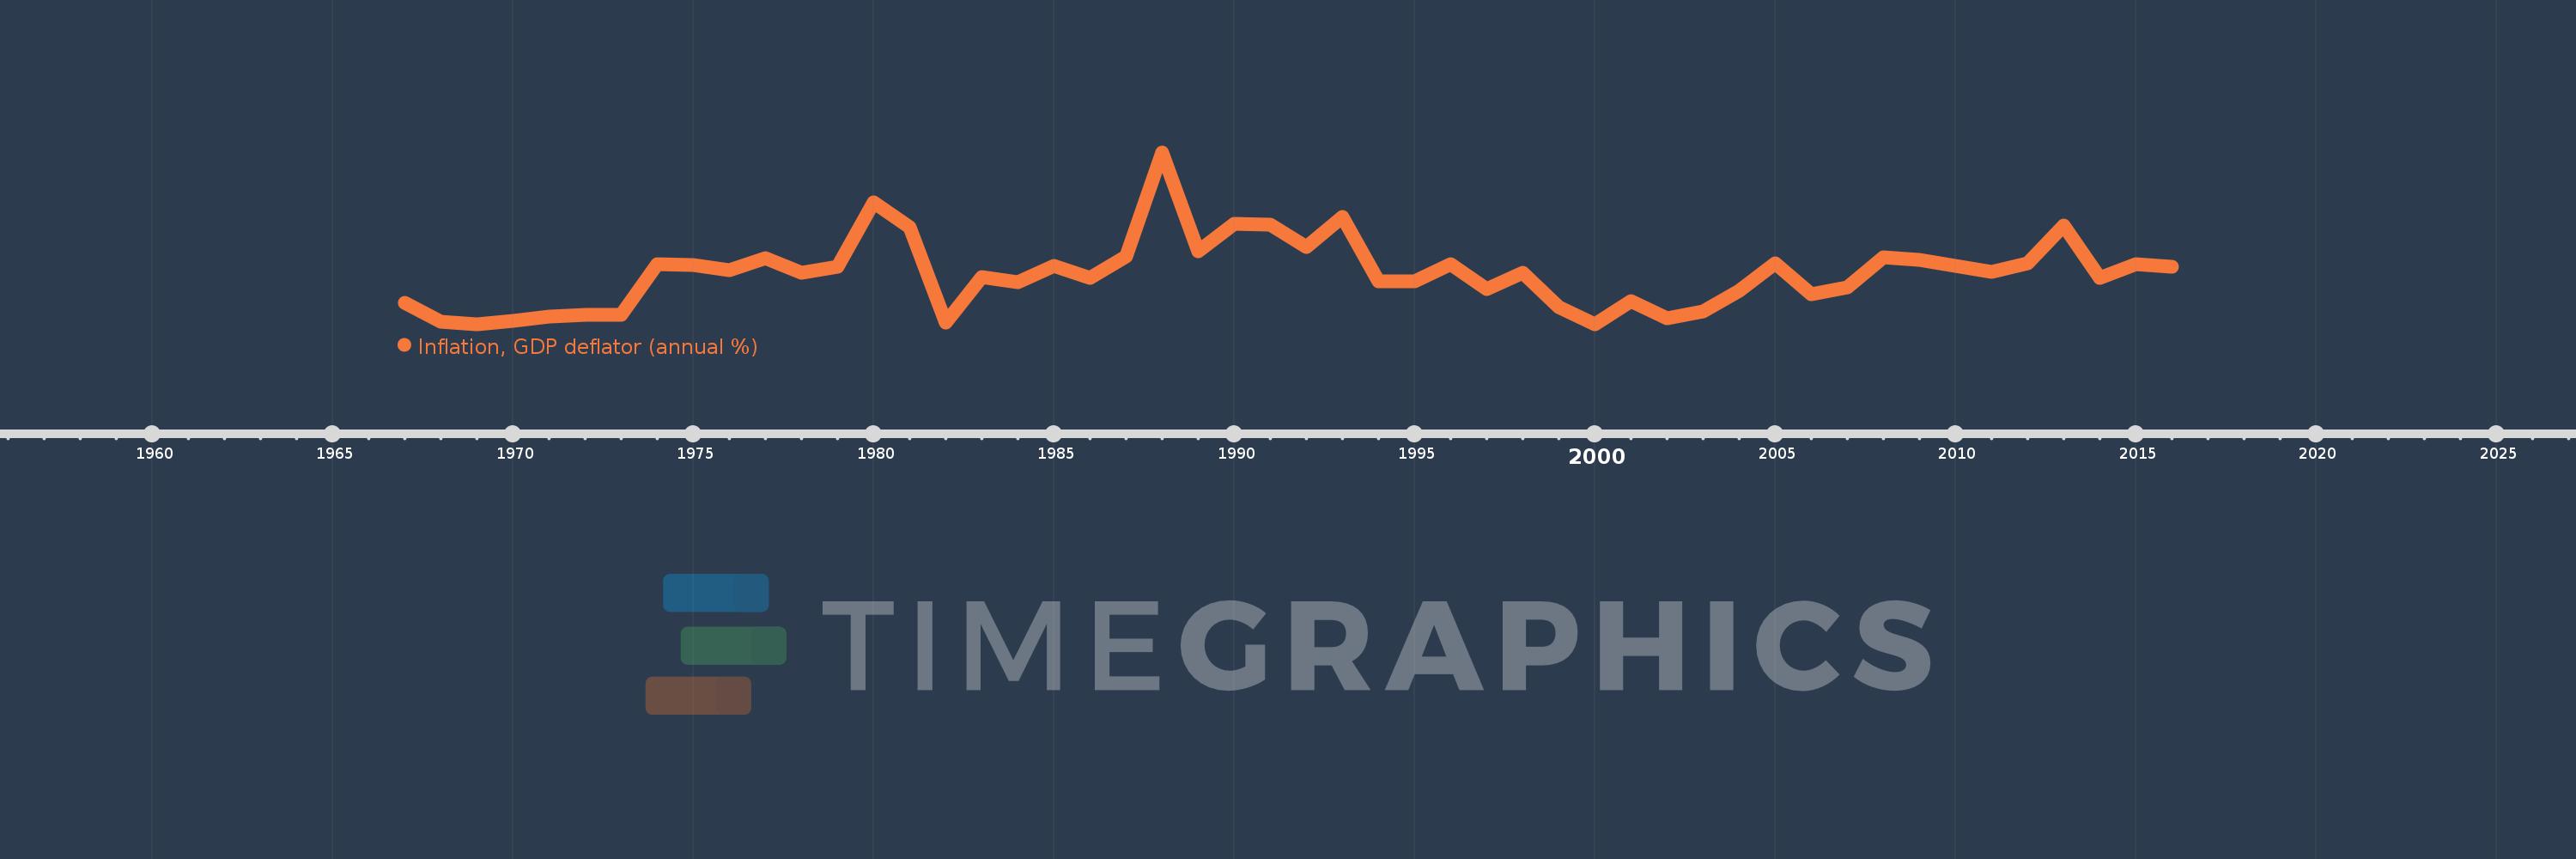
Inflation, GDP deflator (annual %)
2016,2015,2014,2013,2012,2011,2010,2009,2008,2007,2006,2005,2004,2003,2002,2001,2000,1999,1998,1997,1996,1995,1994,1993,1992,1991,1990,1989,1988,1987,1986,1985,1984,1983,1982,1981,1980,1979,1978,1977,1976,1975,1974,1973,1972,1971,1970,1969,1968,1967
This statistics in other country:
AfghanistanAlbaniaAlgeriaAndorraAngolaAntigua and BarbudaArab WorldArgentinaArmeniaArubaAustraliaAustriaAzerbaijanBahamas, TheBahrainBangladeshBarbadosBelarusBelgiumBelizeBeninBermudaBhutanBoliviaBosnia and HerzegovinaBotswanaBrazilBrunei DarussalamBulgariaBurkina FasoBurundiCabo VerdeCambodiaCameroonCanadaCaribbean small statesCayman IslandsCentral African RepublicCentral Europe and the BalticsChadChannel IslandsChileChinaColombiaComorosCongo, Dem. Rep.Congo, Rep.Costa RicaCote d'IvoireCroatiaCubaCyprusCzech RepublicDenmarkDjiboutiDominicaDominican RepublicEarly-demographic dividendEast Asia & PacificEast Asia & Pacific (excluding high income)East Asia & Pacific (IDA & IBRD countries)EcuadorEgypt, Arab Rep.El SalvadorEquatorial GuineaEritreaEstoniaEthiopiaEuro areaEurope & Central AsiaEurope & Central Asia (excluding high income)Europe & Central Asia (IDA & IBRD countries)European UnionFijiFinlandFragile and conflict affected situationsFranceFrench PolynesiaGabonGambia, TheGeorgiaGermanyGhanaGreeceGreenlandGrenadaGuatemalaGuineaGuinea-BissauGuyanaHaitiHeavily indebted poor countries (HIPC)High incomeHondurasHong Kong SAR, ChinaHungaryIBRD onlyIcelandIDA & IBRD totalIDA blendIDA onlyIDA totalIndiaIndonesiaIran, Islamic Rep.IraqIrelandIsle of ManIsraelItalyJamaicaJapanJordanKazakhstanKenyaKiribatiKorea, Rep.KosovoKuwaitKyrgyz RepublicLao PDRLate-demographic dividendLatin America & Caribbean Latin America & Caribbean (excluding high income)Latin America & the Caribbean (IDA & IBRD countries)LatviaLeast developed countries: UN classificationLebanonLesothoLiberiaLibyaLiechtensteinLithuaniaLow & middle incomeLow incomeLower middle incomeLuxembourgMacao SAR, ChinaMacedonia, FYRMadagascarMalawiMalaysiaMaldivesMaliMaltaMarshall IslandsMauritaniaMauritiusMexicoMicronesia, Fed. Sts.Middle East & North AfricaMiddle East & North Africa (excluding high income)Middle East & North Africa (IDA & IBRD countries)Middle incomeMoldovaMonacoMongoliaMontenegroMoroccoMozambiqueMyanmarNamibiaNauruNepalNetherlandsNew CaledoniaNew ZealandNicaraguaNigerNigeriaNorth AmericaNorwayOECD membersOmanOther small statesPacific island small statesPakistanPalauPanamaPapua New GuineaParaguayPeruPhilippinesPolandPortugalPost-demographic dividendPre-demographic dividendPuerto RicoQatarRomaniaRussian FederationRwandaSamoaSan MarinoSao Tome and PrincipeSaudi ArabiaSenegalSerbiaSeychellesSierra LeoneSingaporeSlovak RepublicSloveniaSmall statesSolomon IslandsSomaliaSouth AfricaSouth AsiaSouth Asia (IDA & IBRD)South SudanSpainSri LankaSt. Kitts and NevisSt. LuciaSt. Vincent and the GrenadinesSub-Saharan Africa Sub-Saharan Africa (excluding high income)Sub-Saharan Africa (IDA & IBRD countries)SudanSurinameSwazilandSwedenSwitzerlandSyrian Arab RepublicTajikistanTanzaniaThailandTimor-LesteTogoTongaTrinidad and TobagoTunisiaTurkeyTurkmenistanTuvaluUgandaUkraineUnited Arab EmiratesUnited KingdomUnited StatesUpper middle incomeUruguayUzbekistanVanuatuVenezuela, RBVietnamVirgin Islands (U.S.)West Bank and GazaWorldYemen, Rep.ZambiaZimbabwe Timeline:
This timeline shows a graph from 1967 to 2016 of Egypt, Arab Rep.. No data until 1966. Number of actual observations by date: 50.
Source name:
World Development Indicators
Source organization:
World Bank national accounts data, and OECD National Accounts data files.
Categories, topics:
Economy & Growth
Last updated:
apr 23, 2017
Indicators value changes by year
Maximum:
31.138
jan 1, 1988
At the date of observation
Value
Absolute change
Change from previous value
jan 1, 1967
4.608
+4.608
0.0%
jan 1, 1968
1.35
-3.258
-70.69%
jan 1, 1969
0.893
-0.457
-33.88%
jan 1, 1970
1.471
+0.578
64.69%
jan 1, 1971
2.2
+0.73
49.61%
jan 1, 1972
2.449
+0.248
11.29%
jan 1, 1973
2.511
+0.063
2.56%
jan 1, 1974
11.497
+8.986
357.84%
jan 1, 1975
11.231
-0.267
-2.32%
jan 1, 1976
10.39
-0.84
-7.48%
jan 1, 1977
12.468
+2.078
20.0%
jan 1, 1978
9.926
-2.542
-20.39%
jan 1, 1979
10.976
+1.049
10.57%
jan 1, 1980
22.322
+11.347
103.38%
jan 1, 1981
18.03
-4.292
-19.23%
jan 1, 1982
1.188
-16.842
-93.41%
jan 1, 1983
9.167
+7.979
671.61%
jan 1, 1984
8.293
-0.874
-9.53%
jan 1, 1985
11.16
+2.867
34.57%
jan 1, 1986
9.038
-2.122
-19.02%
jan 1, 1987
12.782
+3.745
41.44%
jan 1, 1988
31.138
+18.356
143.6%
jan 1, 1989
13.653
-17.485
-56.15%
jan 1, 1990
18.537
+4.884
35.77%
jan 1, 1991
18.441
-0.097
-0.52%
jan 1, 1992
14.479
-3.962
-21.49%
jan 1, 1993
19.733
+5.255
36.29%
jan 1, 1994
8.429
-11.304
-57.29%
jan 1, 1995
8.449
+0.02
0.23%
jan 1, 1996
11.4
+2.951
34.93%
jan 1, 1997
7.108
-4.292
-37.65%
jan 1, 1998
9.878
+2.77
38.97%
jan 1, 1999
3.892
-5.985
-60.59%
jan 1, 2000
0.87
-3.022
-77.65%
jan 1, 2001
4.933
+4.063
467.02%
jan 1, 2002
1.868
-3.065
-62.14%
jan 1, 2003
3.185
+1.318
70.55%
jan 1, 2004
6.777
+3.592
112.76%
jan 1, 2005
11.67
+4.893
72.19%
jan 1, 2006
6.213
-5.457
-46.76%
jan 1, 2007
7.361
+1.148
18.47%
jan 1, 2008
12.596
+5.235
71.12%
jan 1, 2009
12.208
-0.387
-3.07%
jan 1, 2010
11.173
-1.035
-8.48%
jan 1, 2011
10.115
-1.058
-9.47%
jan 1, 2012
11.606
+1.491
14.74%
jan 1, 2013
18.229
+6.623
57.07%
jan 1, 2014
9.004
-9.225
-50.61%
jan 1, 2015
11.513
+2.509
27.87%
jan 1, 2016
10.941
-0.572
-4.97%
Ranking of countries by current statistics by years


Comments: