29
/
en
AIzaSyAYiBZKx7MnpbEhh9jyipgxe19OcubqV5w
April 1, 2024
54883
Post-demographic dividend
PST
false
2
1
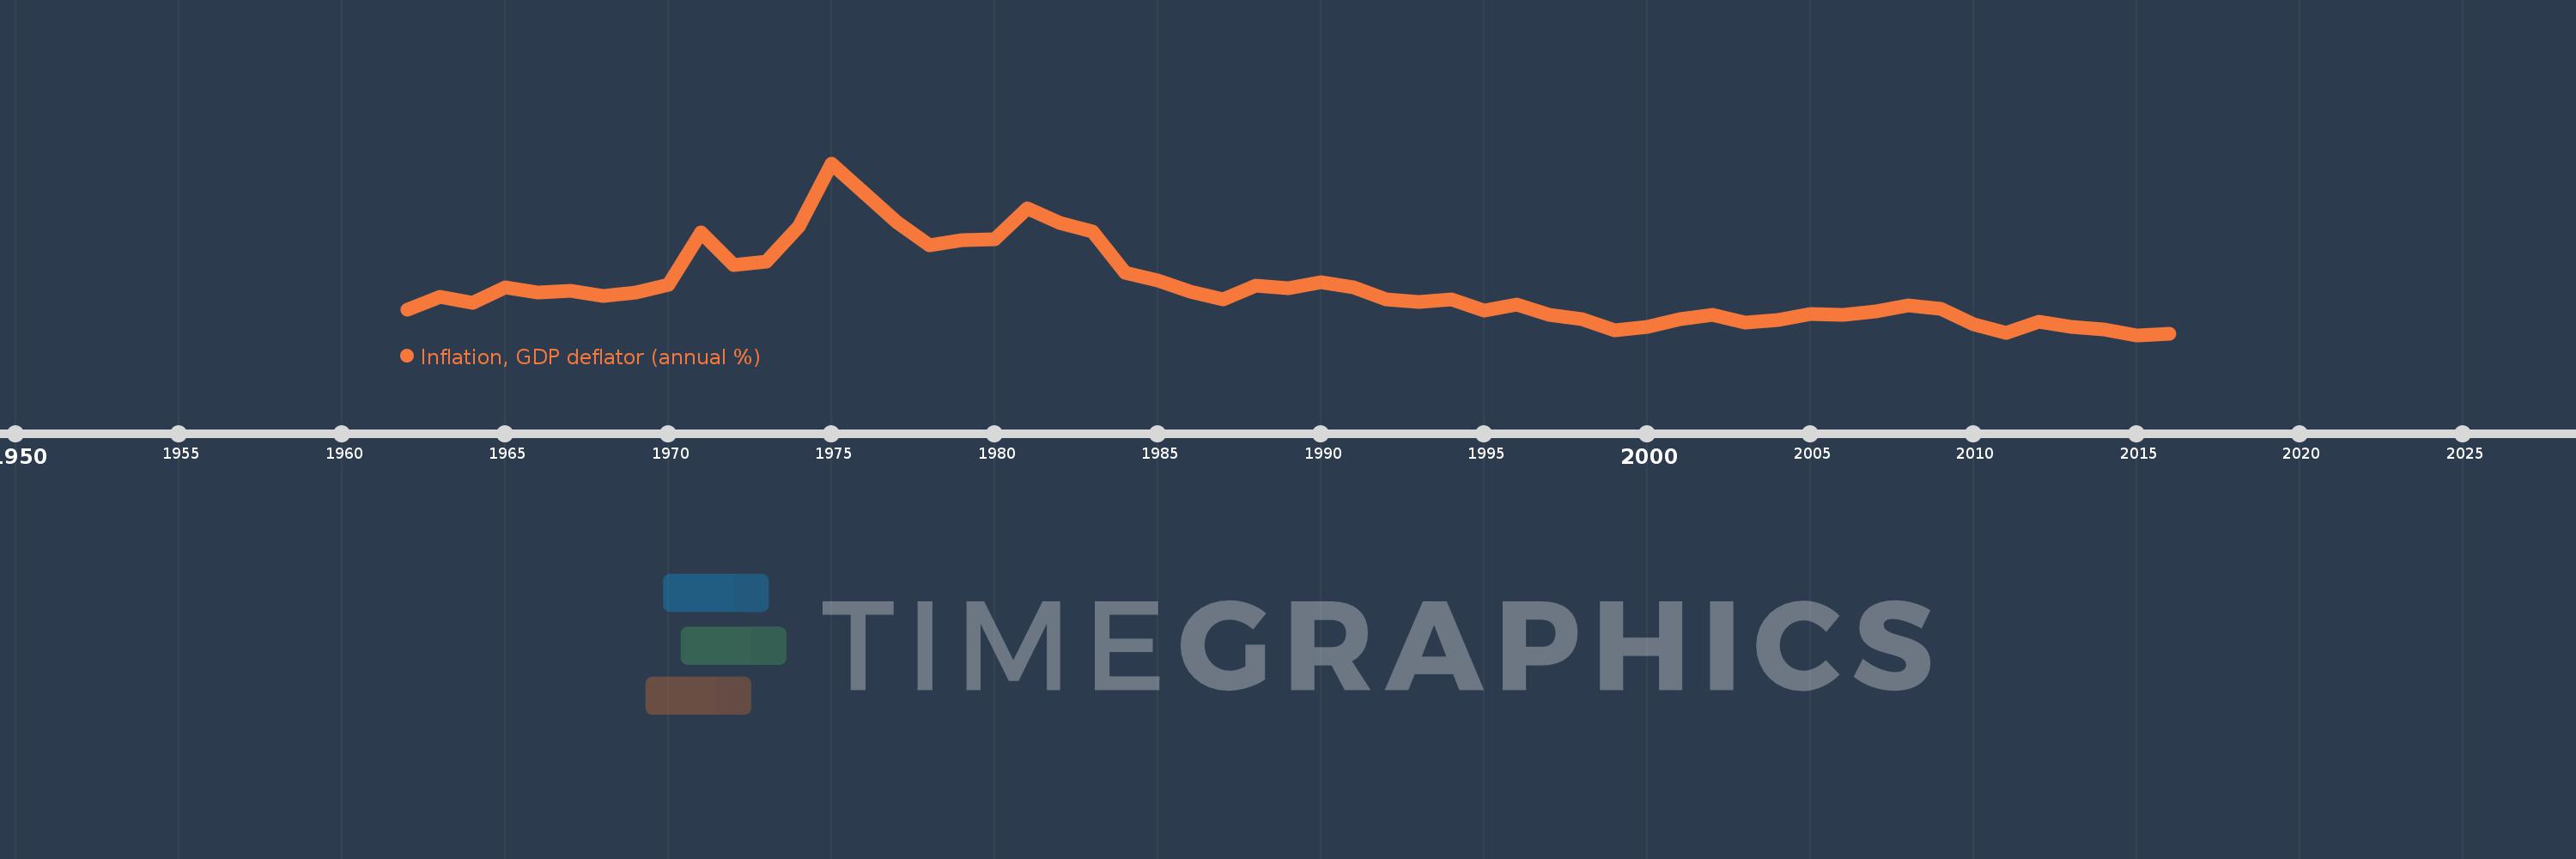
Inflation, GDP deflator (annual %)
2016,2015,2014,2013,2012,2011,2010,2009,2008,2007,2006,2005,2004,2003,2002,2001,2000,1999,1998,1997,1996,1995,1994,1993,1992,1991,1990,1989,1988,1987,1986,1985,1984,1983,1982,1981,1980,1979,1978,1977,1976,1975,1974,1973,1972,1971,1970,1969,1968,1967,1966,1965,1964,1963,1962
This statistics in other country:
AfghanistanAlbaniaAlgeriaAndorraAngolaAntigua and BarbudaArab WorldArgentinaArmeniaArubaAustraliaAustriaAzerbaijanBahamas, TheBahrainBangladeshBarbadosBelarusBelgiumBelizeBeninBermudaBhutanBoliviaBosnia and HerzegovinaBotswanaBrazilBrunei DarussalamBulgariaBurkina FasoBurundiCabo VerdeCambodiaCameroonCanadaCaribbean small statesCayman IslandsCentral African RepublicCentral Europe and the BalticsChadChannel IslandsChileChinaColombiaComorosCongo, Dem. Rep.Congo, Rep.Costa RicaCote d'IvoireCroatiaCubaCyprusCzech RepublicDenmarkDjiboutiDominicaDominican RepublicEarly-demographic dividendEast Asia & PacificEast Asia & Pacific (excluding high income)East Asia & Pacific (IDA & IBRD countries)EcuadorEgypt, Arab Rep.El SalvadorEquatorial GuineaEritreaEstoniaEthiopiaEuro areaEurope & Central AsiaEurope & Central Asia (excluding high income)Europe & Central Asia (IDA & IBRD countries)European UnionFijiFinlandFragile and conflict affected situationsFranceFrench PolynesiaGabonGambia, TheGeorgiaGermanyGhanaGreeceGreenlandGrenadaGuatemalaGuineaGuinea-BissauGuyanaHaitiHeavily indebted poor countries (HIPC)High incomeHondurasHong Kong SAR, ChinaHungaryIBRD onlyIcelandIDA & IBRD totalIDA blendIDA onlyIDA totalIndiaIndonesiaIran, Islamic Rep.IraqIrelandIsle of ManIsraelItalyJamaicaJapanJordanKazakhstanKenyaKiribatiKorea, Rep.KosovoKuwaitKyrgyz RepublicLao PDRLate-demographic dividendLatin America & Caribbean Latin America & Caribbean (excluding high income)Latin America & the Caribbean (IDA & IBRD countries)LatviaLeast developed countries: UN classificationLebanonLesothoLiberiaLibyaLiechtensteinLithuaniaLow & middle incomeLow incomeLower middle incomeLuxembourgMacao SAR, ChinaMacedonia, FYRMadagascarMalawiMalaysiaMaldivesMaliMaltaMarshall IslandsMauritaniaMauritiusMexicoMicronesia, Fed. Sts.Middle East & North AfricaMiddle East & North Africa (excluding high income)Middle East & North Africa (IDA & IBRD countries)Middle incomeMoldovaMonacoMongoliaMontenegroMoroccoMozambiqueMyanmarNamibiaNauruNepalNetherlandsNew CaledoniaNew ZealandNicaraguaNigerNigeriaNorth AmericaNorwayOECD membersOmanOther small statesPacific island small statesPakistanPalauPanamaPapua New GuineaParaguayPeruPhilippinesPolandPortugalPost-demographic dividendPre-demographic dividendPuerto RicoQatarRomaniaRussian FederationRwandaSamoaSan MarinoSao Tome and PrincipeSaudi ArabiaSenegalSerbiaSeychellesSierra LeoneSingaporeSlovak RepublicSloveniaSmall statesSolomon IslandsSomaliaSouth AfricaSouth AsiaSouth Asia (IDA & IBRD)South SudanSpainSri LankaSt. Kitts and NevisSt. LuciaSt. Vincent and the GrenadinesSub-Saharan Africa Sub-Saharan Africa (excluding high income)Sub-Saharan Africa (IDA & IBRD countries)SudanSurinameSwazilandSwedenSwitzerlandSyrian Arab RepublicTajikistanTanzaniaThailandTimor-LesteTogoTongaTrinidad and TobagoTunisiaTurkeyTurkmenistanTuvaluUgandaUkraineUnited Arab EmiratesUnited KingdomUnited StatesUpper middle incomeUruguayUzbekistanVanuatuVenezuela, RBVietnamVirgin Islands (U.S.)West Bank and GazaWorldYemen, Rep.ZambiaZimbabwe Timeline:
This timeline shows a graph from 1962 to 2016 of Post-demographic dividend. No data until 1961. Number of actual observations by date: 55.
Source name:
World Development Indicators
Source organization:
World Bank national accounts data, and OECD National Accounts data files.
Categories, topics:
Economy & Growth
Last updated:
apr 23, 2017
Indicators value changes by year
At the date of observation
Value
Absolute change
Change from previous value
jan 1, 1962
2.86
+2.86
0.0%
jan 1, 1963
3.895
+1.034
36.15%
jan 1, 1964
3.393
-0.502
-12.89%
jan 1, 1965
4.611
+1.218
35.91%
jan 1, 1966
4.197
-0.414
-8.98%
jan 1, 1967
4.319
+0.122
2.9%
jan 1, 1968
3.937
-0.382
-8.85%
jan 1, 1969
4.197
+0.26
6.6%
jan 1, 1970
4.76
+0.564
13.43%
jan 1, 1971
8.769
+4.008
84.2%
jan 1, 1972
6.294
-2.474
-28.22%
jan 1, 1973
6.561
+0.266
4.23%
jan 1, 1974
9.231
+2.671
40.71%
jan 1, 1975
14.05
+4.819
52.2%
jan 1, 1976
11.792
-2.258
-16.07%
jan 1, 1977
9.567
-2.226
-18.87%
jan 1, 1978
7.824
-1.743
-18.22%
jan 1, 1979
8.175
+0.351
4.49%
jan 1, 1980
8.28
+0.105
1.29%
jan 1, 1981
10.643
+2.363
28.54%
jan 1, 1982
9.521
-1.122
-10.55%
jan 1, 1983
8.838
-0.683
-7.17%
jan 1, 1984
5.698
-3.14
-35.53%
jan 1, 1985
5.12
-0.578
-10.14%
jan 1, 1986
4.254
-0.866
-16.9%
jan 1, 1987
3.644
-0.61
-14.34%
jan 1, 1988
4.741
+1.097
30.1%
jan 1, 1989
4.544
-0.197
-4.15%
jan 1, 1990
4.953
+0.409
8.99%
jan 1, 1991
4.604
-0.349
-7.06%
jan 1, 1992
3.642
-0.962
-20.89%
jan 1, 1993
3.452
-0.19
-5.22%
jan 1, 1994
3.644
+0.192
5.57%
jan 1, 1995
2.789
-0.855
-23.46%
jan 1, 1996
3.289
+0.5
17.93%
jan 1, 1997
2.473
-0.817
-24.83%
jan 1, 1998
2.147
-0.326
-13.18%
jan 1, 1999
1.34
-0.807
-37.58%
jan 1, 2000
1.575
+0.236
17.58%
jan 1, 2001
2.15
+0.574
36.44%
jan 1, 2002
2.512
+0.362
16.84%
jan 1, 2003
1.876
-0.636
-25.32%
jan 1, 2004
2.076
+0.2
10.68%
jan 1, 2005
2.548
+0.472
22.75%
jan 1, 2006
2.482
-0.066
-2.6%
jan 1, 2007
2.746
+0.264
10.63%
jan 1, 2008
3.228
+0.483
17.58%
jan 1, 2009
2.978
-0.25
-7.73%
jan 1, 2010
1.801
-1.178
-39.53%
jan 1, 2011
1.143
-0.658
-36.52%
jan 1, 2012
1.948
+0.804
70.35%
jan 1, 2013
1.548
-0.4
-20.52%
jan 1, 2014
1.363
-0.185
-11.96%
jan 1, 2015
0.955
-0.408
-29.93%
jan 1, 2016
1.076
+0.121
12.67%
Ranking of countries by current statistics by years


Comments: