29
/
en
AIzaSyAYiBZKx7MnpbEhh9jyipgxe19OcubqV5w
April 1, 2024
101231
Canada
CAN
true
2
1
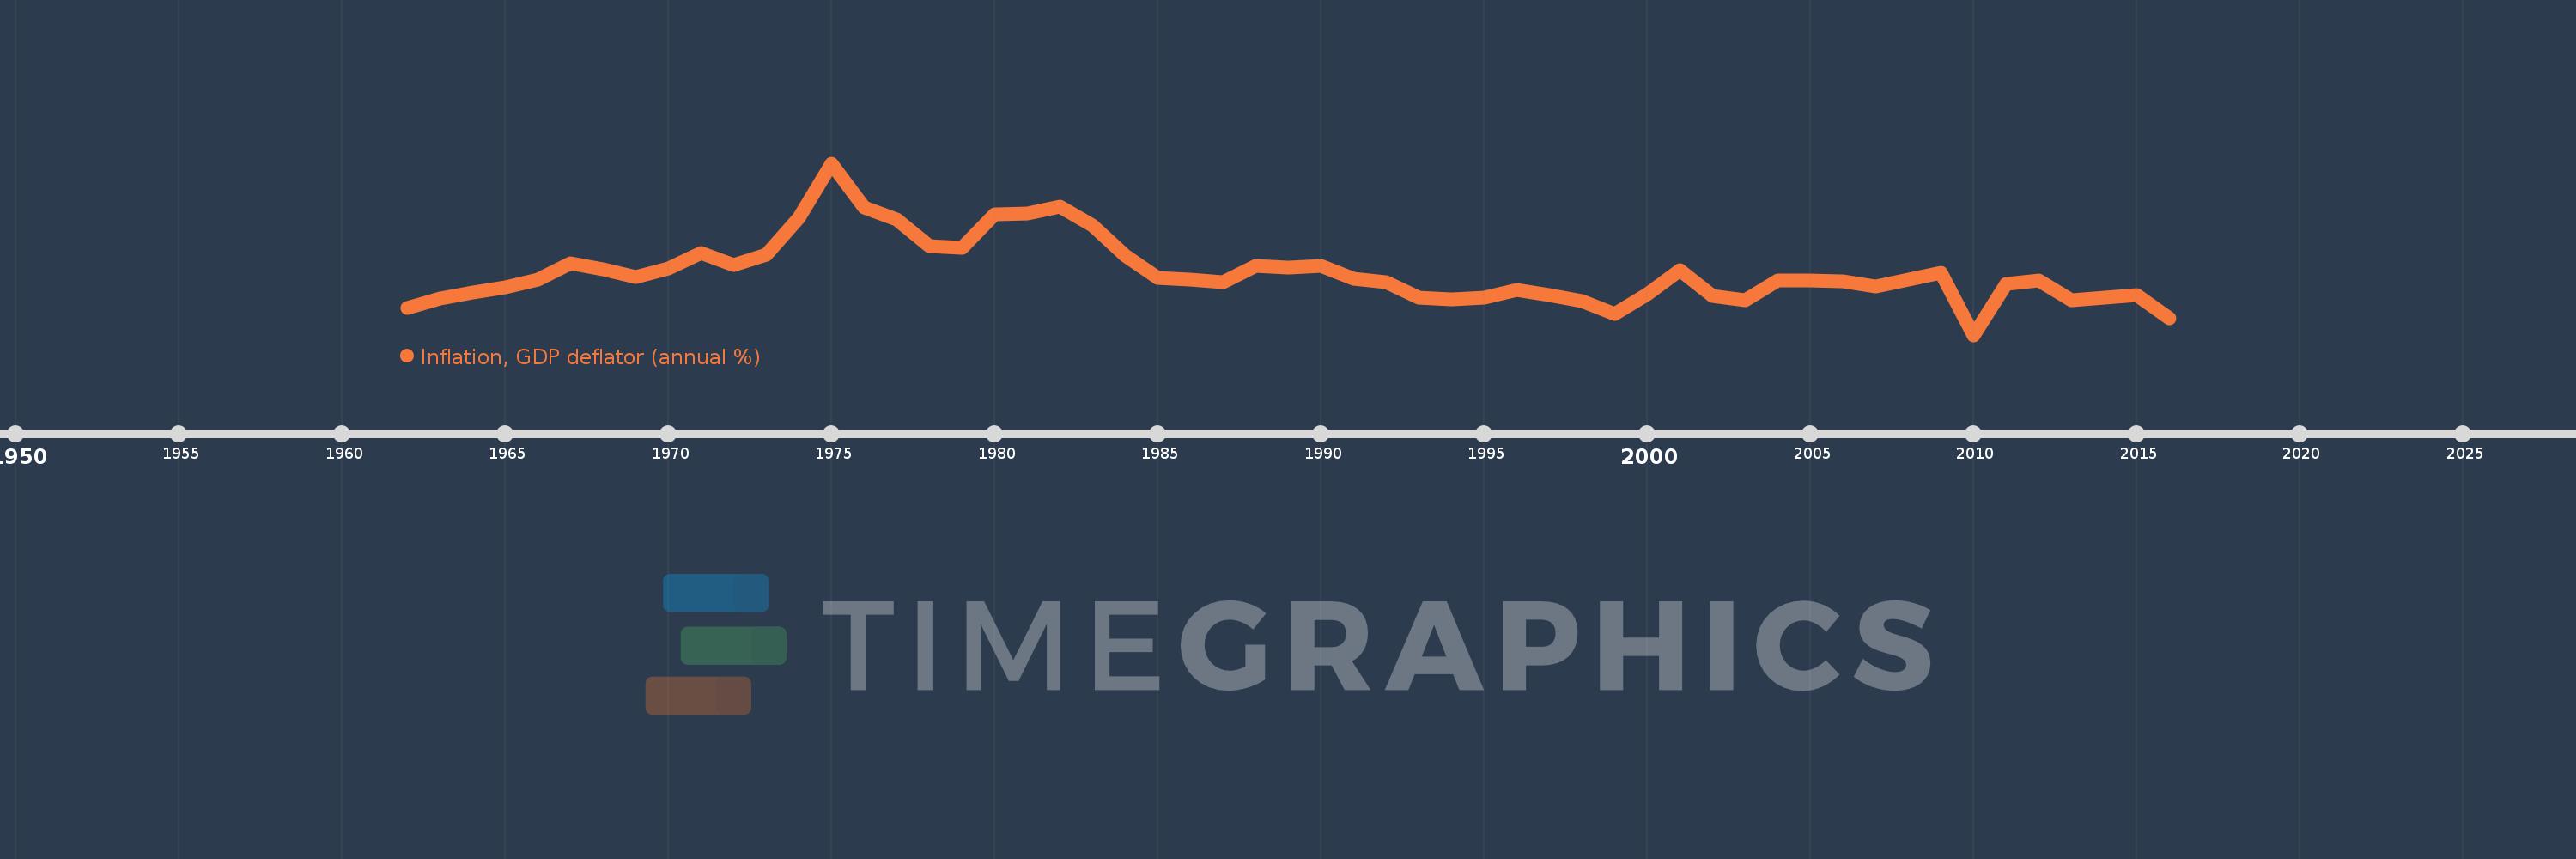
Inflation, GDP deflator (annual %)
2016,2015,2014,2013,2012,2011,2010,2009,2008,2007,2006,2005,2004,2003,2002,2001,2000,1999,1998,1997,1996,1995,1994,1993,1992,1991,1990,1989,1988,1987,1986,1985,1984,1983,1982,1981,1980,1979,1978,1977,1976,1975,1974,1973,1972,1971,1970,1969,1968,1967,1966,1965,1964,1963,1962
This statistics in other country:
AfghanistanAlbaniaAlgeriaAndorraAngolaAntigua and BarbudaArab WorldArgentinaArmeniaArubaAustraliaAustriaAzerbaijanBahamas, TheBahrainBangladeshBarbadosBelarusBelgiumBelizeBeninBermudaBhutanBoliviaBosnia and HerzegovinaBotswanaBrazilBrunei DarussalamBulgariaBurkina FasoBurundiCabo VerdeCambodiaCameroonCanadaCaribbean small statesCayman IslandsCentral African RepublicCentral Europe and the BalticsChadChannel IslandsChileChinaColombiaComorosCongo, Dem. Rep.Congo, Rep.Costa RicaCote d'IvoireCroatiaCubaCyprusCzech RepublicDenmarkDjiboutiDominicaDominican RepublicEarly-demographic dividendEast Asia & PacificEast Asia & Pacific (excluding high income)East Asia & Pacific (IDA & IBRD countries)EcuadorEgypt, Arab Rep.El SalvadorEquatorial GuineaEritreaEstoniaEthiopiaEuro areaEurope & Central AsiaEurope & Central Asia (excluding high income)Europe & Central Asia (IDA & IBRD countries)European UnionFijiFinlandFragile and conflict affected situationsFranceFrench PolynesiaGabonGambia, TheGeorgiaGermanyGhanaGreeceGreenlandGrenadaGuatemalaGuineaGuinea-BissauGuyanaHaitiHeavily indebted poor countries (HIPC)High incomeHondurasHong Kong SAR, ChinaHungaryIBRD onlyIcelandIDA & IBRD totalIDA blendIDA onlyIDA totalIndiaIndonesiaIran, Islamic Rep.IraqIrelandIsle of ManIsraelItalyJamaicaJapanJordanKazakhstanKenyaKiribatiKorea, Rep.KosovoKuwaitKyrgyz RepublicLao PDRLate-demographic dividendLatin America & Caribbean Latin America & Caribbean (excluding high income)Latin America & the Caribbean (IDA & IBRD countries)LatviaLeast developed countries: UN classificationLebanonLesothoLiberiaLibyaLiechtensteinLithuaniaLow & middle incomeLow incomeLower middle incomeLuxembourgMacao SAR, ChinaMacedonia, FYRMadagascarMalawiMalaysiaMaldivesMaliMaltaMarshall IslandsMauritaniaMauritiusMexicoMicronesia, Fed. Sts.Middle East & North AfricaMiddle East & North Africa (excluding high income)Middle East & North Africa (IDA & IBRD countries)Middle incomeMoldovaMonacoMongoliaMontenegroMoroccoMozambiqueMyanmarNamibiaNauruNepalNetherlandsNew CaledoniaNew ZealandNicaraguaNigerNigeriaNorth AmericaNorwayOECD membersOmanOther small statesPacific island small statesPakistanPalauPanamaPapua New GuineaParaguayPeruPhilippinesPolandPortugalPost-demographic dividendPre-demographic dividendPuerto RicoQatarRomaniaRussian FederationRwandaSamoaSan MarinoSao Tome and PrincipeSaudi ArabiaSenegalSerbiaSeychellesSierra LeoneSingaporeSlovak RepublicSloveniaSmall statesSolomon IslandsSomaliaSouth AfricaSouth AsiaSouth Asia (IDA & IBRD)South SudanSpainSri LankaSt. Kitts and NevisSt. LuciaSt. Vincent and the GrenadinesSub-Saharan Africa Sub-Saharan Africa (excluding high income)Sub-Saharan Africa (IDA & IBRD countries)SudanSurinameSwazilandSwedenSwitzerlandSyrian Arab RepublicTajikistanTanzaniaThailandTimor-LesteTogoTongaTrinidad and TobagoTunisiaTurkeyTurkmenistanTuvaluUgandaUkraineUnited Arab EmiratesUnited KingdomUnited StatesUpper middle incomeUruguayUzbekistanVanuatuVenezuela, RBVietnamVirgin Islands (U.S.)West Bank and GazaWorldYemen, Rep.ZambiaZimbabwe Timeline:
This timeline shows a graph from 1962 to 2016 of Canada. No data until 1961. Number of actual observations by date: 55.
Source name:
World Development Indicators
Source organization:
World Bank national accounts data, and OECD National Accounts data files.
Categories, topics:
Economy & Growth
Last updated:
apr 23, 2017
Indicators value changes by year
Minimum:
-2.294
jan 1, 2010
Maximum:
15.198
jan 1, 1975
At the date of observation
Value
Absolute change
Change from previous value
jan 1, 1962
0.458
+0.458
0.0%
jan 1, 1963
1.414
+0.956
208.73%
jan 1, 1964
2.061
+0.647
45.75%
jan 1, 1965
2.599
+0.538
26.11%
jan 1, 1966
3.36
+0.76
29.25%
jan 1, 1967
4.981
+1.621
48.25%
jan 1, 1968
4.402
-0.579
-11.63%
jan 1, 1969
3.636
-0.766
-17.4%
jan 1, 1970
4.506
+0.87
23.93%
jan 1, 1971
6.057
+1.551
34.42%
jan 1, 1972
4.832
-1.225
-20.22%
jan 1, 1973
5.9
+1.068
22.11%
jan 1, 1974
9.687
+3.787
64.18%
jan 1, 1975
15.198
+5.511
56.9%
jan 1, 1976
10.695
-4.503
-29.63%
jan 1, 1977
9.497
-1.198
-11.2%
jan 1, 1978
6.797
-2.7
-28.43%
jan 1, 1979
6.603
-0.194
-2.85%
jan 1, 1980
9.986
+3.383
51.23%
jan 1, 1981
10.072
+0.086
0.86%
jan 1, 1982
10.777
+0.705
7.0%
jan 1, 1983
8.838
-1.939
-17.99%
jan 1, 1984
5.763
-3.075
-34.8%
jan 1, 1985
3.528
-2.235
-38.78%
jan 1, 1986
3.328
-0.2
-5.66%
jan 1, 1987
3.067
-0.261
-7.84%
jan 1, 1988
4.761
+1.694
55.22%
jan 1, 1989
4.544
-0.217
-4.55%
jan 1, 1990
4.713
+0.169
3.72%
jan 1, 1991
3.423
-1.29
-27.37%
jan 1, 1992
3.094
-0.329
-9.61%
jan 1, 1993
1.501
-1.593
-51.47%
jan 1, 1994
1.303
-0.199
-13.22%
jan 1, 1995
1.47
+0.167
12.85%
jan 1, 1996
2.261
+0.79
53.75%
jan 1, 1997
1.745
-0.516
-22.83%
jan 1, 1998
1.141
-0.603
-34.58%
jan 1, 1999
-0.18
-1.322
-115.81%
jan 1, 2000
1.904
+2.084
-1.16K%
jan 1, 2001
4.341
+2.437
128.02%
jan 1, 2002
1.658
-2.683
-61.8%
jan 1, 2003
1.244
-0.414
-24.97%
jan 1, 2004
3.256
+2.012
161.68%
jan 1, 2005
3.28
+0.024
0.75%
jan 1, 2006
3.147
-0.133
-4.06%
jan 1, 2007
2.613
-0.534
-16.96%
jan 1, 2008
3.319
+0.705
26.99%
jan 1, 2009
4.005
+0.686
20.68%
jan 1, 2010
-2.294
-6.299
-157.28%
jan 1, 2011
2.874
+5.168
-225.27%
jan 1, 2012
3.242
+0.368
12.8%
jan 1, 2013
1.221
-2.021
-62.33%
jan 1, 2014
1.554
+0.333
27.24%
jan 1, 2015
1.756
+0.203
13.03%
jan 1, 2016
-0.553
-2.31
-131.49%
Ranking of countries by current statistics by years


Comments: