29
/
en
AIzaSyAYiBZKx7MnpbEhh9jyipgxe19OcubqV5w
April 1, 2024
74055
Austria
AUT
true
2
1
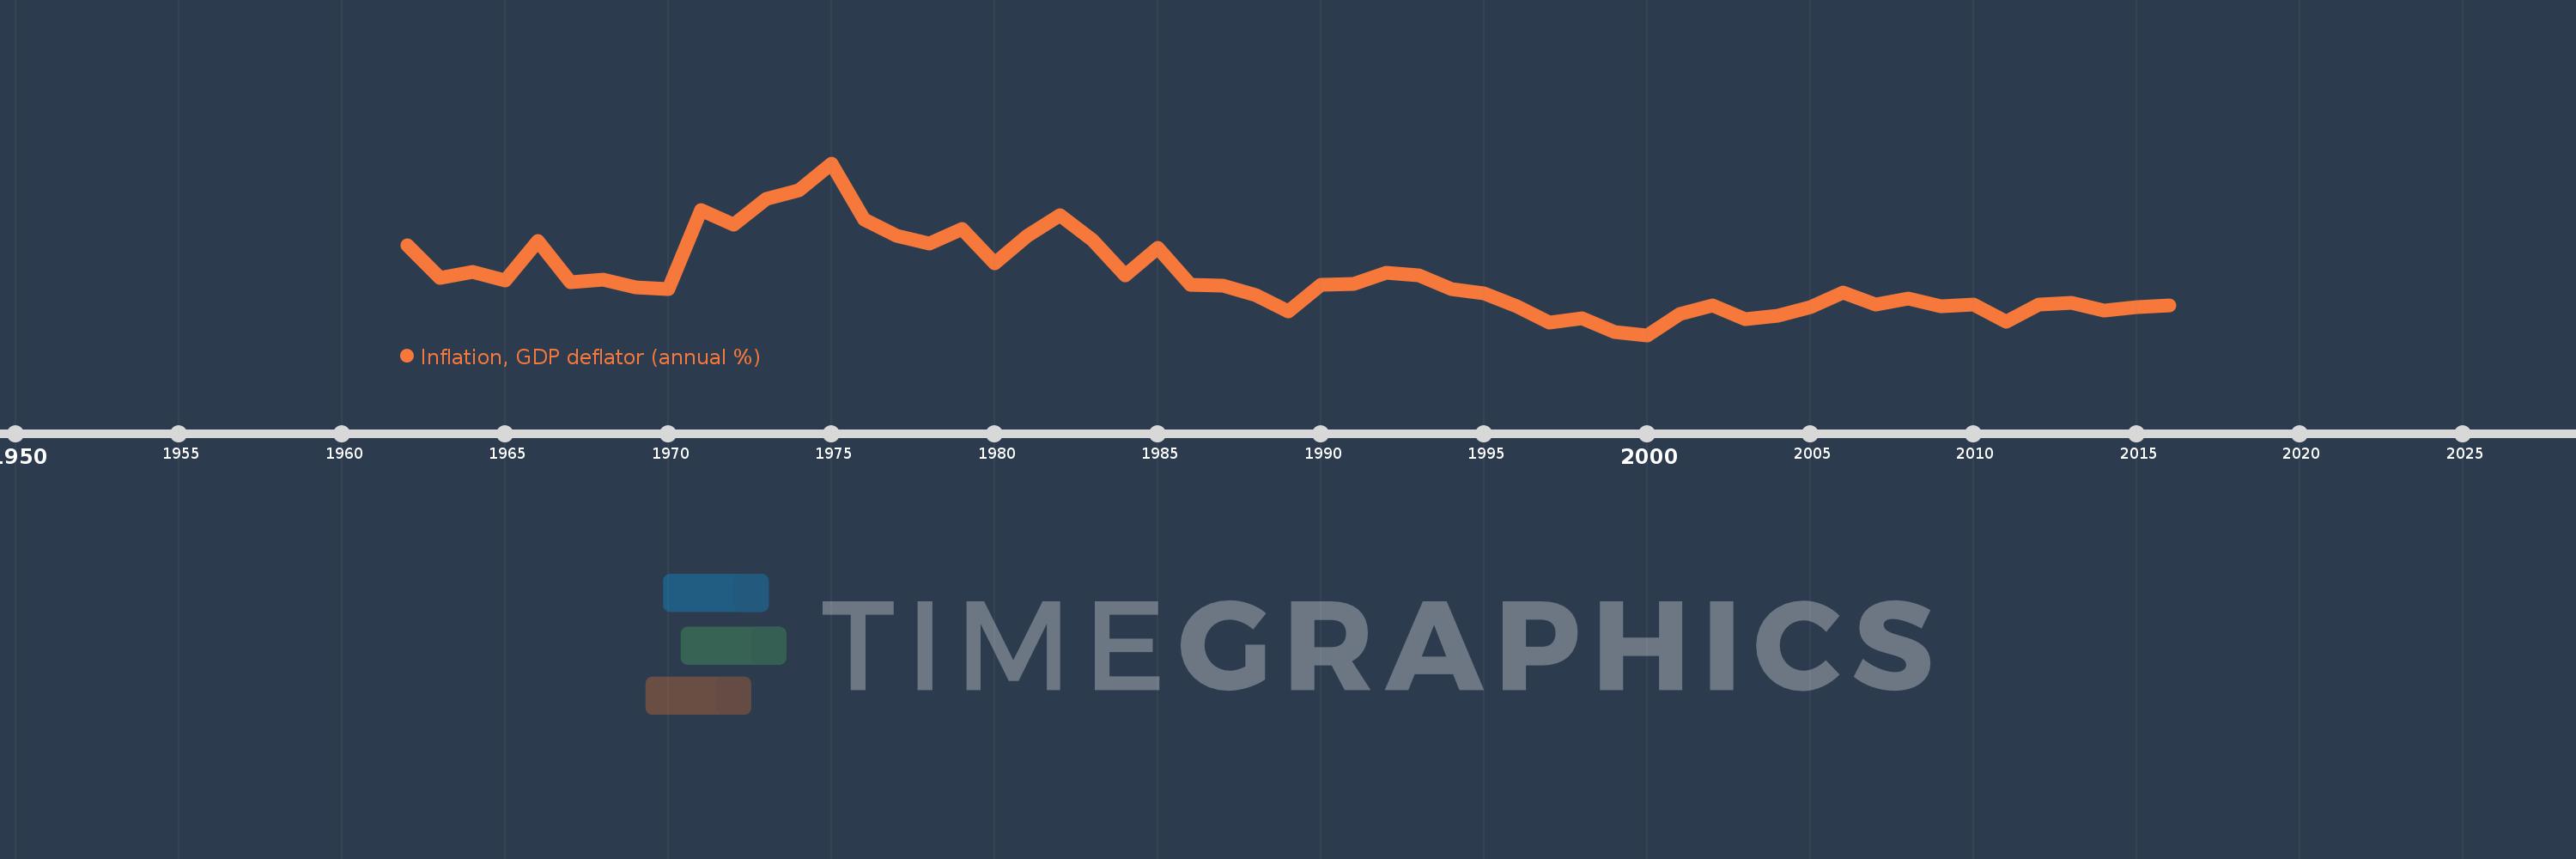
Inflation, GDP deflator (annual %)
2016,2015,2014,2013,2012,2011,2010,2009,2008,2007,2006,2005,2004,2003,2002,2001,2000,1999,1998,1997,1996,1995,1994,1993,1992,1991,1990,1989,1988,1987,1986,1985,1984,1983,1982,1981,1980,1979,1978,1977,1976,1975,1974,1973,1972,1971,1970,1969,1968,1967,1966,1965,1964,1963,1962
This statistics in other country:
AfghanistanAlbaniaAlgeriaAndorraAngolaAntigua and BarbudaArab WorldArgentinaArmeniaArubaAustraliaAustriaAzerbaijanBahamas, TheBahrainBangladeshBarbadosBelarusBelgiumBelizeBeninBermudaBhutanBoliviaBosnia and HerzegovinaBotswanaBrazilBrunei DarussalamBulgariaBurkina FasoBurundiCabo VerdeCambodiaCameroonCanadaCaribbean small statesCayman IslandsCentral African RepublicCentral Europe and the BalticsChadChannel IslandsChileChinaColombiaComorosCongo, Dem. Rep.Congo, Rep.Costa RicaCote d'IvoireCroatiaCubaCyprusCzech RepublicDenmarkDjiboutiDominicaDominican RepublicEarly-demographic dividendEast Asia & PacificEast Asia & Pacific (excluding high income)East Asia & Pacific (IDA & IBRD countries)EcuadorEgypt, Arab Rep.El SalvadorEquatorial GuineaEritreaEstoniaEthiopiaEuro areaEurope & Central AsiaEurope & Central Asia (excluding high income)Europe & Central Asia (IDA & IBRD countries)European UnionFijiFinlandFragile and conflict affected situationsFranceFrench PolynesiaGabonGambia, TheGeorgiaGermanyGhanaGreeceGreenlandGrenadaGuatemalaGuineaGuinea-BissauGuyanaHaitiHeavily indebted poor countries (HIPC)High incomeHondurasHong Kong SAR, ChinaHungaryIBRD onlyIcelandIDA & IBRD totalIDA blendIDA onlyIDA totalIndiaIndonesiaIran, Islamic Rep.IraqIrelandIsle of ManIsraelItalyJamaicaJapanJordanKazakhstanKenyaKiribatiKorea, Rep.KosovoKuwaitKyrgyz RepublicLao PDRLate-demographic dividendLatin America & Caribbean Latin America & Caribbean (excluding high income)Latin America & the Caribbean (IDA & IBRD countries)LatviaLeast developed countries: UN classificationLebanonLesothoLiberiaLibyaLiechtensteinLithuaniaLow & middle incomeLow incomeLower middle incomeLuxembourgMacao SAR, ChinaMacedonia, FYRMadagascarMalawiMalaysiaMaldivesMaliMaltaMarshall IslandsMauritaniaMauritiusMexicoMicronesia, Fed. Sts.Middle East & North AfricaMiddle East & North Africa (excluding high income)Middle East & North Africa (IDA & IBRD countries)Middle incomeMoldovaMonacoMongoliaMontenegroMoroccoMozambiqueMyanmarNamibiaNauruNepalNetherlandsNew CaledoniaNew ZealandNicaraguaNigerNigeriaNorth AmericaNorwayOECD membersOmanOther small statesPacific island small statesPakistanPalauPanamaPapua New GuineaParaguayPeruPhilippinesPolandPortugalPost-demographic dividendPre-demographic dividendPuerto RicoQatarRomaniaRussian FederationRwandaSamoaSan MarinoSao Tome and PrincipeSaudi ArabiaSenegalSerbiaSeychellesSierra LeoneSingaporeSlovak RepublicSloveniaSmall statesSolomon IslandsSomaliaSouth AfricaSouth AsiaSouth Asia (IDA & IBRD)South SudanSpainSri LankaSt. Kitts and NevisSt. LuciaSt. Vincent and the GrenadinesSub-Saharan Africa Sub-Saharan Africa (excluding high income)Sub-Saharan Africa (IDA & IBRD countries)SudanSurinameSwazilandSwedenSwitzerlandSyrian Arab RepublicTajikistanTanzaniaThailandTimor-LesteTogoTongaTrinidad and TobagoTunisiaTurkeyTurkmenistanTuvaluUgandaUkraineUnited Arab EmiratesUnited KingdomUnited StatesUpper middle incomeUruguayUzbekistanVanuatuVenezuela, RBVietnamVirgin Islands (U.S.)West Bank and GazaWorldYemen, Rep.ZambiaZimbabwe Timeline:
This timeline shows a graph from 1962 to 2016 of Austria. No data until 1961. Number of actual observations by date: 55.
Source name:
World Development Indicators
Source organization:
World Bank national accounts data, and OECD National Accounts data files.
Categories, topics:
Economy & Growth
Last updated:
apr 23, 2017
Indicators value changes by year
At the date of observation
Value
Absolute change
Change from previous value
jan 1, 1962
5.087
+5.087
0.0%
jan 1, 1963
3.34
-1.747
-34.34%
jan 1, 1964
3.678
+0.338
10.12%
jan 1, 1965
3.184
-0.494
-13.44%
jan 1, 1966
5.321
+2.138
67.14%
jan 1, 1967
3.122
-2.199
-41.32%
jan 1, 1968
3.248
+0.125
4.02%
jan 1, 1969
2.838
-0.41
-12.62%
jan 1, 1970
2.734
-0.104
-3.68%
jan 1, 1971
6.975
+4.241
155.15%
jan 1, 1972
6.204
-0.77
-11.05%
jan 1, 1973
7.6
+1.396
22.49%
jan 1, 1974
8.046
+0.446
5.86%
jan 1, 1975
9.502
+1.457
18.1%
jan 1, 1976
6.458
-3.044
-32.04%
jan 1, 1977
5.625
-0.833
-12.9%
jan 1, 1978
5.199
-0.426
-7.58%
jan 1, 1979
5.993
+0.794
15.28%
jan 1, 1980
4.114
-1.879
-31.35%
jan 1, 1981
5.581
+1.466
35.64%
jan 1, 1982
6.717
+1.136
20.36%
jan 1, 1983
5.355
-1.361
-20.27%
jan 1, 1984
3.473
-1.883
-35.15%
jan 1, 1985
4.95
+1.477
42.53%
jan 1, 1986
2.963
-1.987
-40.14%
jan 1, 1987
2.951
-0.012
-0.4%
jan 1, 1988
2.437
-0.514
-17.42%
jan 1, 1989
1.527
-0.91
-37.35%
jan 1, 1990
2.965
+1.438
94.17%
jan 1, 1991
3.0
+0.035
1.18%
jan 1, 1992
3.642
+0.642
21.41%
jan 1, 1993
3.479
-0.163
-4.47%
jan 1, 1994
2.757
-0.722
-20.75%
jan 1, 1995
2.525
-0.232
-8.42%
jan 1, 1996
1.814
-0.711
-28.16%
jan 1, 1997
0.956
-0.858
-47.32%
jan 1, 1998
1.161
+0.205
21.47%
jan 1, 1999
0.418
-0.743
-64.01%
jan 1, 2000
0.276
-0.142
-33.93%
jan 1, 2001
1.391
+1.115
404.11%
jan 1, 2002
1.861
+0.469
33.72%
jan 1, 2003
1.145
-0.715
-38.44%
jan 1, 2004
1.309
+0.164
14.32%
jan 1, 2005
1.794
+0.484
37.0%
jan 1, 2006
2.568
+0.774
43.16%
jan 1, 2007
1.909
-0.659
-25.67%
jan 1, 2008
2.252
+0.343
17.99%
jan 1, 2009
1.819
-0.433
-19.24%
jan 1, 2010
1.905
+0.086
4.71%
jan 1, 2011
1.001
-0.904
-47.45%
jan 1, 2012
1.892
+0.891
89.0%
jan 1, 2013
1.989
+0.098
5.16%
jan 1, 2014
1.584
-0.406
-20.39%
jan 1, 2015
1.786
+0.203
12.79%
jan 1, 2016
1.887
+0.101
5.66%
Ranking of countries by current statistics by years


Comments: