29
/
en
AIzaSyAYiBZKx7MnpbEhh9jyipgxe19OcubqV5w
April 1, 2024
159555
Ireland
IRL
true
2
1
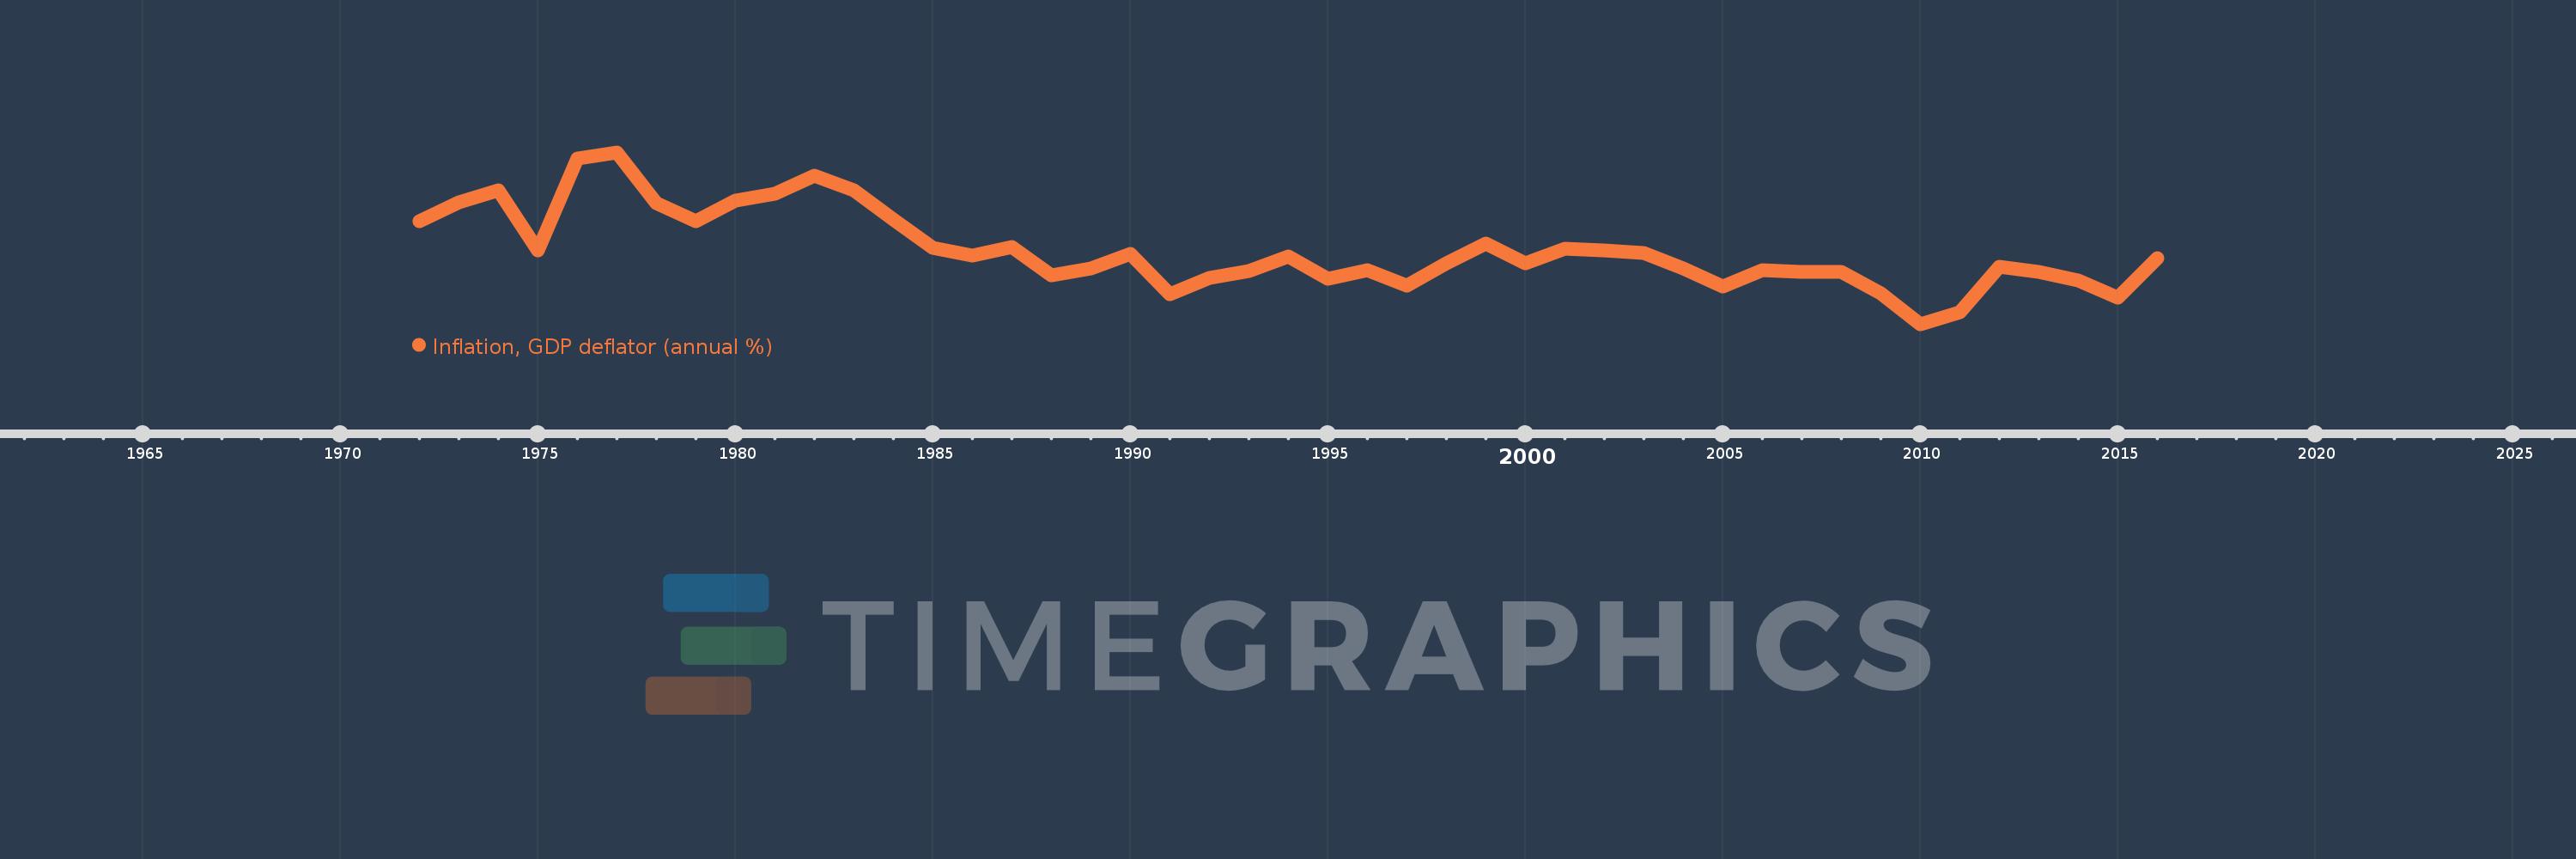
Inflation, GDP deflator (annual %)
2016,2015,2014,2013,2012,2011,2010,2009,2008,2007,2006,2005,2004,2003,2002,2001,2000,1999,1998,1997,1996,1995,1994,1993,1992,1991,1990,1989,1988,1987,1986,1985,1984,1983,1982,1981,1980,1979,1978,1977,1976,1975,1974,1973,1972
This statistics in other country:
AfghanistanAlbaniaAlgeriaAndorraAngolaAntigua and BarbudaArab WorldArgentinaArmeniaArubaAustraliaAustriaAzerbaijanBahamas, TheBahrainBangladeshBarbadosBelarusBelgiumBelizeBeninBermudaBhutanBoliviaBosnia and HerzegovinaBotswanaBrazilBrunei DarussalamBulgariaBurkina FasoBurundiCabo VerdeCambodiaCameroonCanadaCaribbean small statesCayman IslandsCentral African RepublicCentral Europe and the BalticsChadChannel IslandsChileChinaColombiaComorosCongo, Dem. Rep.Congo, Rep.Costa RicaCote d'IvoireCroatiaCubaCyprusCzech RepublicDenmarkDjiboutiDominicaDominican RepublicEarly-demographic dividendEast Asia & PacificEast Asia & Pacific (excluding high income)East Asia & Pacific (IDA & IBRD countries)EcuadorEgypt, Arab Rep.El SalvadorEquatorial GuineaEritreaEstoniaEthiopiaEuro areaEurope & Central AsiaEurope & Central Asia (excluding high income)Europe & Central Asia (IDA & IBRD countries)European UnionFijiFinlandFragile and conflict affected situationsFranceFrench PolynesiaGabonGambia, TheGeorgiaGermanyGhanaGreeceGreenlandGrenadaGuatemalaGuineaGuinea-BissauGuyanaHaitiHeavily indebted poor countries (HIPC)High incomeHondurasHong Kong SAR, ChinaHungaryIBRD onlyIcelandIDA & IBRD totalIDA blendIDA onlyIDA totalIndiaIndonesiaIran, Islamic Rep.IraqIrelandIsle of ManIsraelItalyJamaicaJapanJordanKazakhstanKenyaKiribatiKorea, Rep.KosovoKuwaitKyrgyz RepublicLao PDRLate-demographic dividendLatin America & Caribbean Latin America & Caribbean (excluding high income)Latin America & the Caribbean (IDA & IBRD countries)LatviaLeast developed countries: UN classificationLebanonLesothoLiberiaLibyaLiechtensteinLithuaniaLow & middle incomeLow incomeLower middle incomeLuxembourgMacao SAR, ChinaMacedonia, FYRMadagascarMalawiMalaysiaMaldivesMaliMaltaMarshall IslandsMauritaniaMauritiusMexicoMicronesia, Fed. Sts.Middle East & North AfricaMiddle East & North Africa (excluding high income)Middle East & North Africa (IDA & IBRD countries)Middle incomeMoldovaMonacoMongoliaMontenegroMoroccoMozambiqueMyanmarNamibiaNauruNepalNetherlandsNew CaledoniaNew ZealandNicaraguaNigerNigeriaNorth AmericaNorwayOECD membersOmanOther small statesPacific island small statesPakistanPalauPanamaPapua New GuineaParaguayPeruPhilippinesPolandPortugalPost-demographic dividendPre-demographic dividendPuerto RicoQatarRomaniaRussian FederationRwandaSamoaSan MarinoSao Tome and PrincipeSaudi ArabiaSenegalSerbiaSeychellesSierra LeoneSingaporeSlovak RepublicSloveniaSmall statesSolomon IslandsSomaliaSouth AfricaSouth AsiaSouth Asia (IDA & IBRD)South SudanSpainSri LankaSt. Kitts and NevisSt. LuciaSt. Vincent and the GrenadinesSub-Saharan Africa Sub-Saharan Africa (excluding high income)Sub-Saharan Africa (IDA & IBRD countries)SudanSurinameSwazilandSwedenSwitzerlandSyrian Arab RepublicTajikistanTanzaniaThailandTimor-LesteTogoTongaTrinidad and TobagoTunisiaTurkeyTurkmenistanTuvaluUgandaUkraineUnited Arab EmiratesUnited KingdomUnited StatesUpper middle incomeUruguayUzbekistanVanuatuVenezuela, RBVietnamVirgin Islands (U.S.)West Bank and GazaWorldYemen, Rep.ZambiaZimbabwe Timeline:
This timeline shows a graph from 1972 to 2016 of Ireland. No data until 1971. Number of actual observations by date: 45.
Source name:
World Development Indicators
Source organization:
World Bank national accounts data, and OECD National Accounts data files.
Categories, topics:
Economy & Growth
Last updated:
apr 23, 2017
Indicators value changes by year
Minimum:
-5.256
jan 1, 2010
Maximum:
21.023
jan 1, 1977
At the date of observation
Value
Absolute change
Change from previous value
jan 1, 1972
10.539
+10.539
0.0%
jan 1, 1973
13.385
+2.846
27.0%
jan 1, 1974
15.273
+1.887
14.1%
jan 1, 1975
6.088
-9.185
-60.14%
jan 1, 1976
20.133
+14.046
230.73%
jan 1, 1977
21.023
+0.89
4.42%
jan 1, 1978
13.269
-7.754
-36.89%
jan 1, 1979
10.526
-2.742
-20.67%
jan 1, 1980
13.676
+3.15
29.92%
jan 1, 1981
14.705
+1.029
7.52%
jan 1, 1982
17.443
+2.738
18.62%
jan 1, 1983
15.182
-2.26
-12.96%
jan 1, 1984
10.709
-4.473
-29.46%
jan 1, 1985
6.379
-4.33
-40.43%
jan 1, 1986
5.186
-1.193
-18.7%
jan 1, 1987
6.55
+1.363
26.29%
jan 1, 1988
2.197
-4.352
-66.45%
jan 1, 1989
3.246
+1.049
47.73%
jan 1, 1990
5.522
+2.275
70.09%
jan 1, 1991
-0.729
-6.251
-113.21%
jan 1, 1992
1.801
+2.531
-347.04%
jan 1, 1993
2.812
+1.011
56.11%
jan 1, 1994
5.176
+2.364
84.05%
jan 1, 1995
1.695
-3.481
-67.26%
jan 1, 1996
3.034
+1.339
79.05%
jan 1, 1997
0.686
-2.348
-77.4%
jan 1, 1998
4.034
+3.348
488.3%
jan 1, 1999
7.03
+2.996
74.26%
jan 1, 2000
4.082
-2.948
-41.94%
jan 1, 2001
6.355
+2.273
55.69%
jan 1, 2002
6.089
-0.266
-4.18%
jan 1, 2003
5.6
-0.489
-8.03%
jan 1, 2004
3.273
-2.328
-41.56%
jan 1, 2005
0.514
-2.759
-84.3%
jan 1, 2006
3.069
+2.556
497.47%
jan 1, 2007
2.697
-0.372
-12.13%
jan 1, 2008
2.711
+0.014
0.51%
jan 1, 2009
-0.518
-3.229
-119.12%
jan 1, 2010
-5.256
-4.738
914.35%
jan 1, 2011
-3.483
+1.773
-33.73%
jan 1, 2012
3.6
+7.083
-203.35%
jan 1, 2013
2.683
-0.917
-25.47%
jan 1, 2014
1.421
-1.262
-47.05%
jan 1, 2015
-1.177
-2.597
-182.81%
jan 1, 2016
4.879
+6.056
-514.7%
Ranking of countries by current statistics by years


Comments: