29
/
en
AIzaSyAYiBZKx7MnpbEhh9jyipgxe19OcubqV5w
April 1, 2024
249994
St. Kitts and Nevis
KNA
true
2
1
Inflation, GDP deflator (annual %)
2016,2015,2014,2013,2012,2011,2010,2009,2008,2007,2006,2005,2004,2003,2002,2001,2000,1999,1998,1997,1996,1995,1994,1993,1992,1991,1990,1989,1988,1987,1986,1985,1984,1983,1982,1981,1980,1979
This statistics in other country:
AfghanistanAlbaniaAlgeriaAndorraAngolaAntigua and BarbudaArab WorldArgentinaArmeniaArubaAustraliaAustriaAzerbaijanBahamas, TheBahrainBangladeshBarbadosBelarusBelgiumBelizeBeninBermudaBhutanBoliviaBosnia and HerzegovinaBotswanaBrazilBrunei DarussalamBulgariaBurkina FasoBurundiCabo VerdeCambodiaCameroonCanadaCaribbean small statesCayman IslandsCentral African RepublicCentral Europe and the BalticsChadChannel IslandsChileChinaColombiaComorosCongo, Dem. Rep.Congo, Rep.Costa RicaCote d'IvoireCroatiaCubaCyprusCzech RepublicDenmarkDjiboutiDominicaDominican RepublicEarly-demographic dividendEast Asia & PacificEast Asia & Pacific (excluding high income)East Asia & Pacific (IDA & IBRD countries)EcuadorEgypt, Arab Rep.El SalvadorEquatorial GuineaEritreaEstoniaEthiopiaEuro areaEurope & Central AsiaEurope & Central Asia (excluding high income)Europe & Central Asia (IDA & IBRD countries)European UnionFijiFinlandFragile and conflict affected situationsFranceFrench PolynesiaGabonGambia, TheGeorgiaGermanyGhanaGreeceGreenlandGrenadaGuatemalaGuineaGuinea-BissauGuyanaHaitiHeavily indebted poor countries (HIPC)High incomeHondurasHong Kong SAR, ChinaHungaryIBRD onlyIcelandIDA & IBRD totalIDA blendIDA onlyIDA totalIndiaIndonesiaIran, Islamic Rep.IraqIrelandIsle of ManIsraelItalyJamaicaJapanJordanKazakhstanKenyaKiribatiKorea, Rep.KosovoKuwaitKyrgyz RepublicLao PDRLate-demographic dividendLatin America & Caribbean Latin America & Caribbean (excluding high income)Latin America & the Caribbean (IDA & IBRD countries)LatviaLeast developed countries: UN classificationLebanonLesothoLiberiaLibyaLiechtensteinLithuaniaLow & middle incomeLow incomeLower middle incomeLuxembourgMacao SAR, ChinaMacedonia, FYRMadagascarMalawiMalaysiaMaldivesMaliMaltaMarshall IslandsMauritaniaMauritiusMexicoMicronesia, Fed. Sts.Middle East & North AfricaMiddle East & North Africa (excluding high income)Middle East & North Africa (IDA & IBRD countries)Middle incomeMoldovaMonacoMongoliaMontenegroMoroccoMozambiqueMyanmarNamibiaNauruNepalNetherlandsNew CaledoniaNew ZealandNicaraguaNigerNigeriaNorth AmericaNorwayOECD membersOmanOther small statesPacific island small statesPakistanPalauPanamaPapua New GuineaParaguayPeruPhilippinesPolandPortugalPost-demographic dividendPre-demographic dividendPuerto RicoQatarRomaniaRussian FederationRwandaSamoaSan MarinoSao Tome and PrincipeSaudi ArabiaSenegalSerbiaSeychellesSierra LeoneSingaporeSlovak RepublicSloveniaSmall statesSolomon IslandsSomaliaSouth AfricaSouth AsiaSouth Asia (IDA & IBRD)South SudanSpainSri LankaSt. Kitts and NevisSt. LuciaSt. Vincent and the GrenadinesSub-Saharan Africa Sub-Saharan Africa (excluding high income)Sub-Saharan Africa (IDA & IBRD countries)SudanSurinameSwazilandSwedenSwitzerlandSyrian Arab RepublicTajikistanTanzaniaThailandTimor-LesteTogoTongaTrinidad and TobagoTunisiaTurkeyTurkmenistanTuvaluUgandaUkraineUnited Arab EmiratesUnited KingdomUnited StatesUpper middle incomeUruguayUzbekistanVanuatuVenezuela, RBVietnamVirgin Islands (U.S.)West Bank and GazaWorldYemen, Rep.ZambiaZimbabwe Timeline:
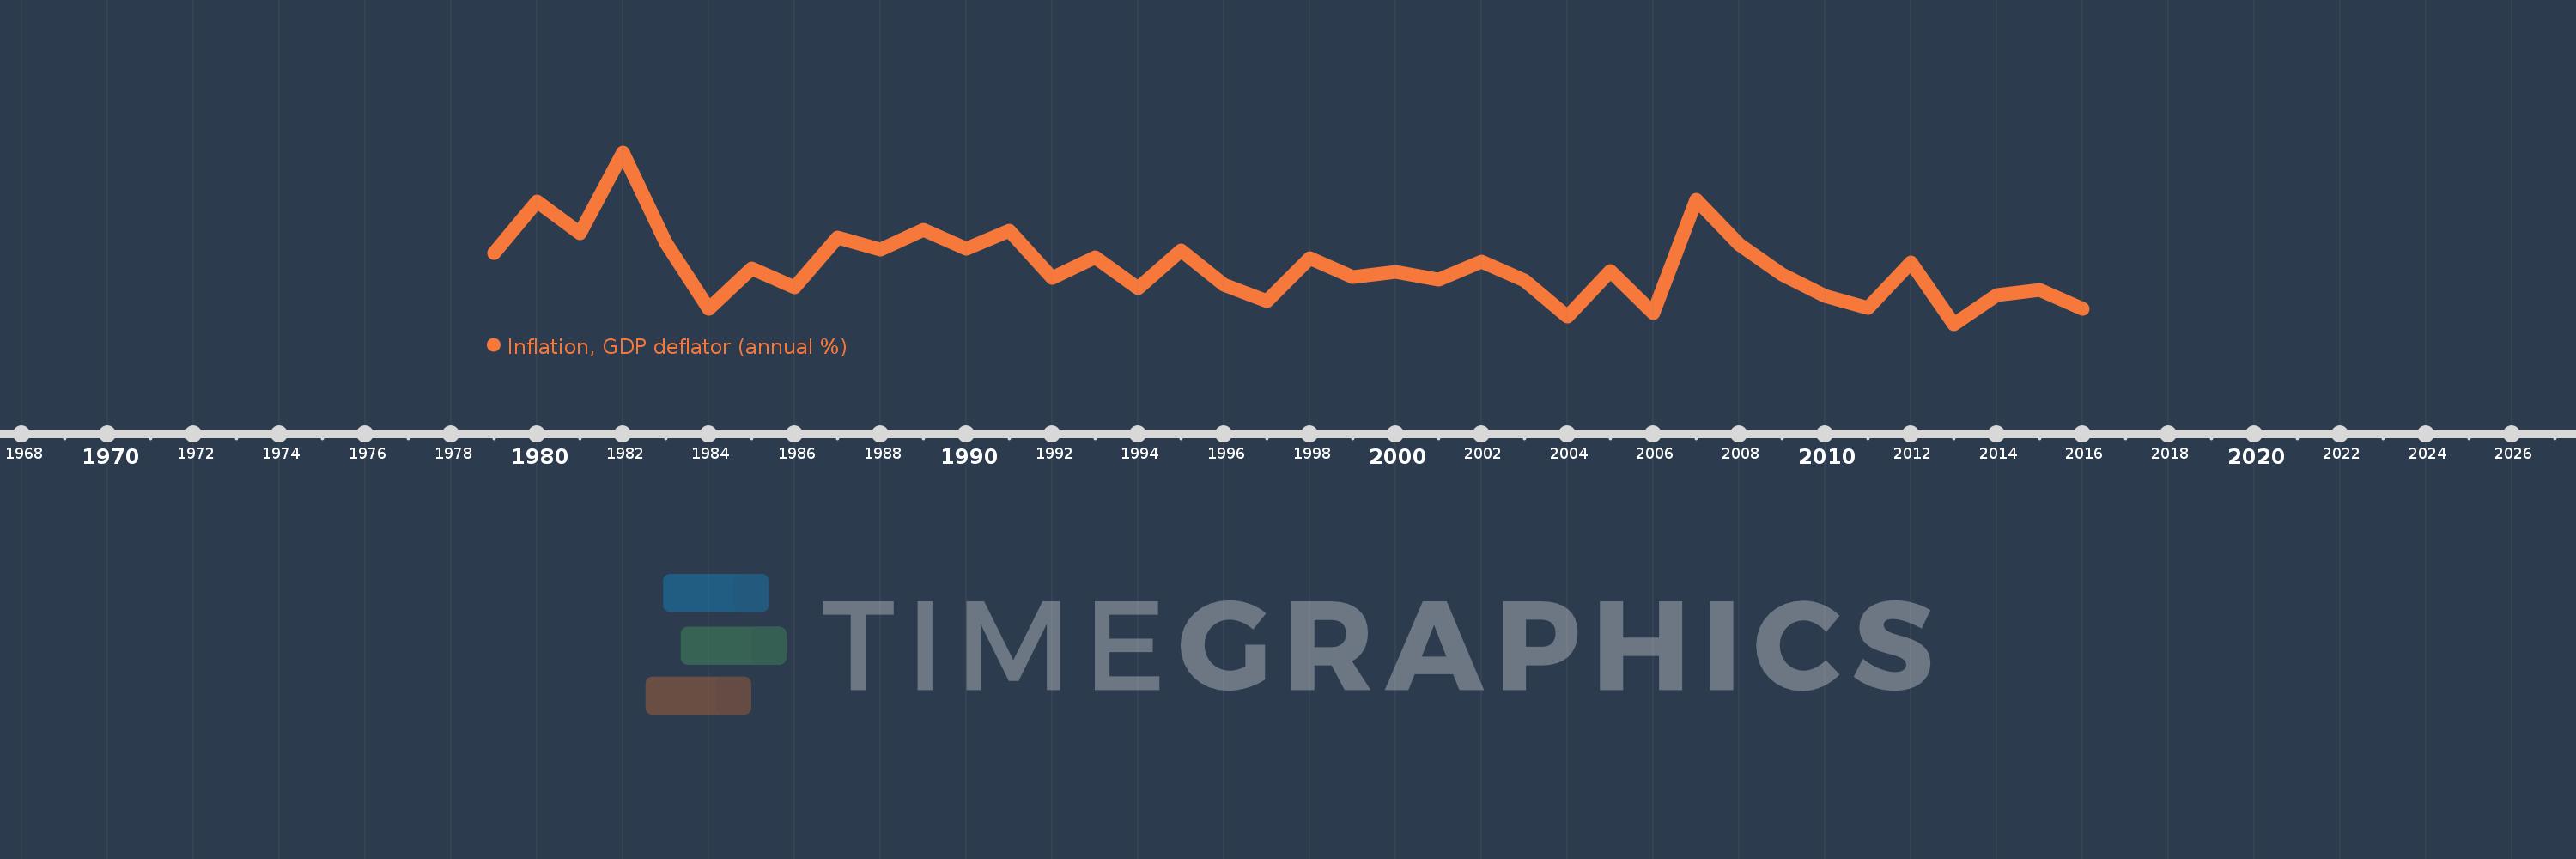
This timeline shows a graph from 1979 to 2016 of St. Kitts and Nevis. No data until 1978. Number of actual observations by date: 38.
Source name:
World Development Indicators
Source organization:
World Bank national accounts data, and OECD National Accounts data files.
Categories, topics:
Economy & Growth
Last updated:
apr 23, 2017
Indicators value changes by year
Minimum:
-1.902
jan 1, 2013
Maximum:
15.403
jan 1, 1982
At the date of observation
Value
Absolute change
Change from previous value
jan 1, 1979
5.271
+5.271
0.0%
jan 1, 1980
10.484
+5.213
98.89%
jan 1, 1981
7.274
-3.209
-30.61%
jan 1, 1982
15.403
+8.129
111.74%
jan 1, 1983
6.273
-9.13
-59.28%
jan 1, 1984
-0.389
-6.662
-106.2%
jan 1, 1985
3.744
+4.132
-1.06K%
jan 1, 1986
1.822
-1.922
-51.33%
jan 1, 1987
6.813
+4.991
273.96%
jan 1, 1988
5.614
-1.199
-17.6%
jan 1, 1989
7.567
+1.953
34.8%
jan 1, 1990
5.706
-1.862
-24.6%
jan 1, 1991
7.516
+1.811
31.73%
jan 1, 1992
2.754
-4.763
-63.36%
jan 1, 1993
4.833
+2.079
75.48%
jan 1, 1994
1.698
-3.135
-64.86%
jan 1, 1995
5.562
+3.864
227.58%
jan 1, 1996
2.1
-3.462
-62.24%
jan 1, 1997
0.442
-1.658
-78.96%
jan 1, 1998
4.742
+4.3
972.88%
jan 1, 1999
2.852
-1.889
-39.84%
jan 1, 2000
3.35
+0.498
17.45%
jan 1, 2001
2.571
-0.779
-23.26%
jan 1, 2002
4.415
+1.844
71.72%
jan 1, 2003
2.536
-1.879
-42.56%
jan 1, 2004
-1.099
-3.635
-143.35%
jan 1, 2005
3.485
+4.584
-416.97%
jan 1, 2006
-0.8
-4.285
-122.96%
jan 1, 2007
10.595
+11.395
-1.42K%
jan 1, 2008
6.127
-4.468
-42.17%
jan 1, 2009
3.144
-2.983
-48.68%
jan 1, 2010
0.919
-2.226
-70.78%
jan 1, 2011
-0.273
-1.191
-129.69%
jan 1, 2012
4.336
+4.608
-1.69K%
jan 1, 2013
-1.902
-6.237
-143.87%
jan 1, 2014
1.028
+2.93
-154.04%
jan 1, 2015
1.511
+0.483
46.97%
jan 1, 2016
-0.364
-1.874
-124.09%
Ranking of countries by current statistics by years


Comments: