29
/
en
AIzaSyAYiBZKx7MnpbEhh9jyipgxe19OcubqV5w
April 1, 2024
215415
Oman
OMN
true
2
1
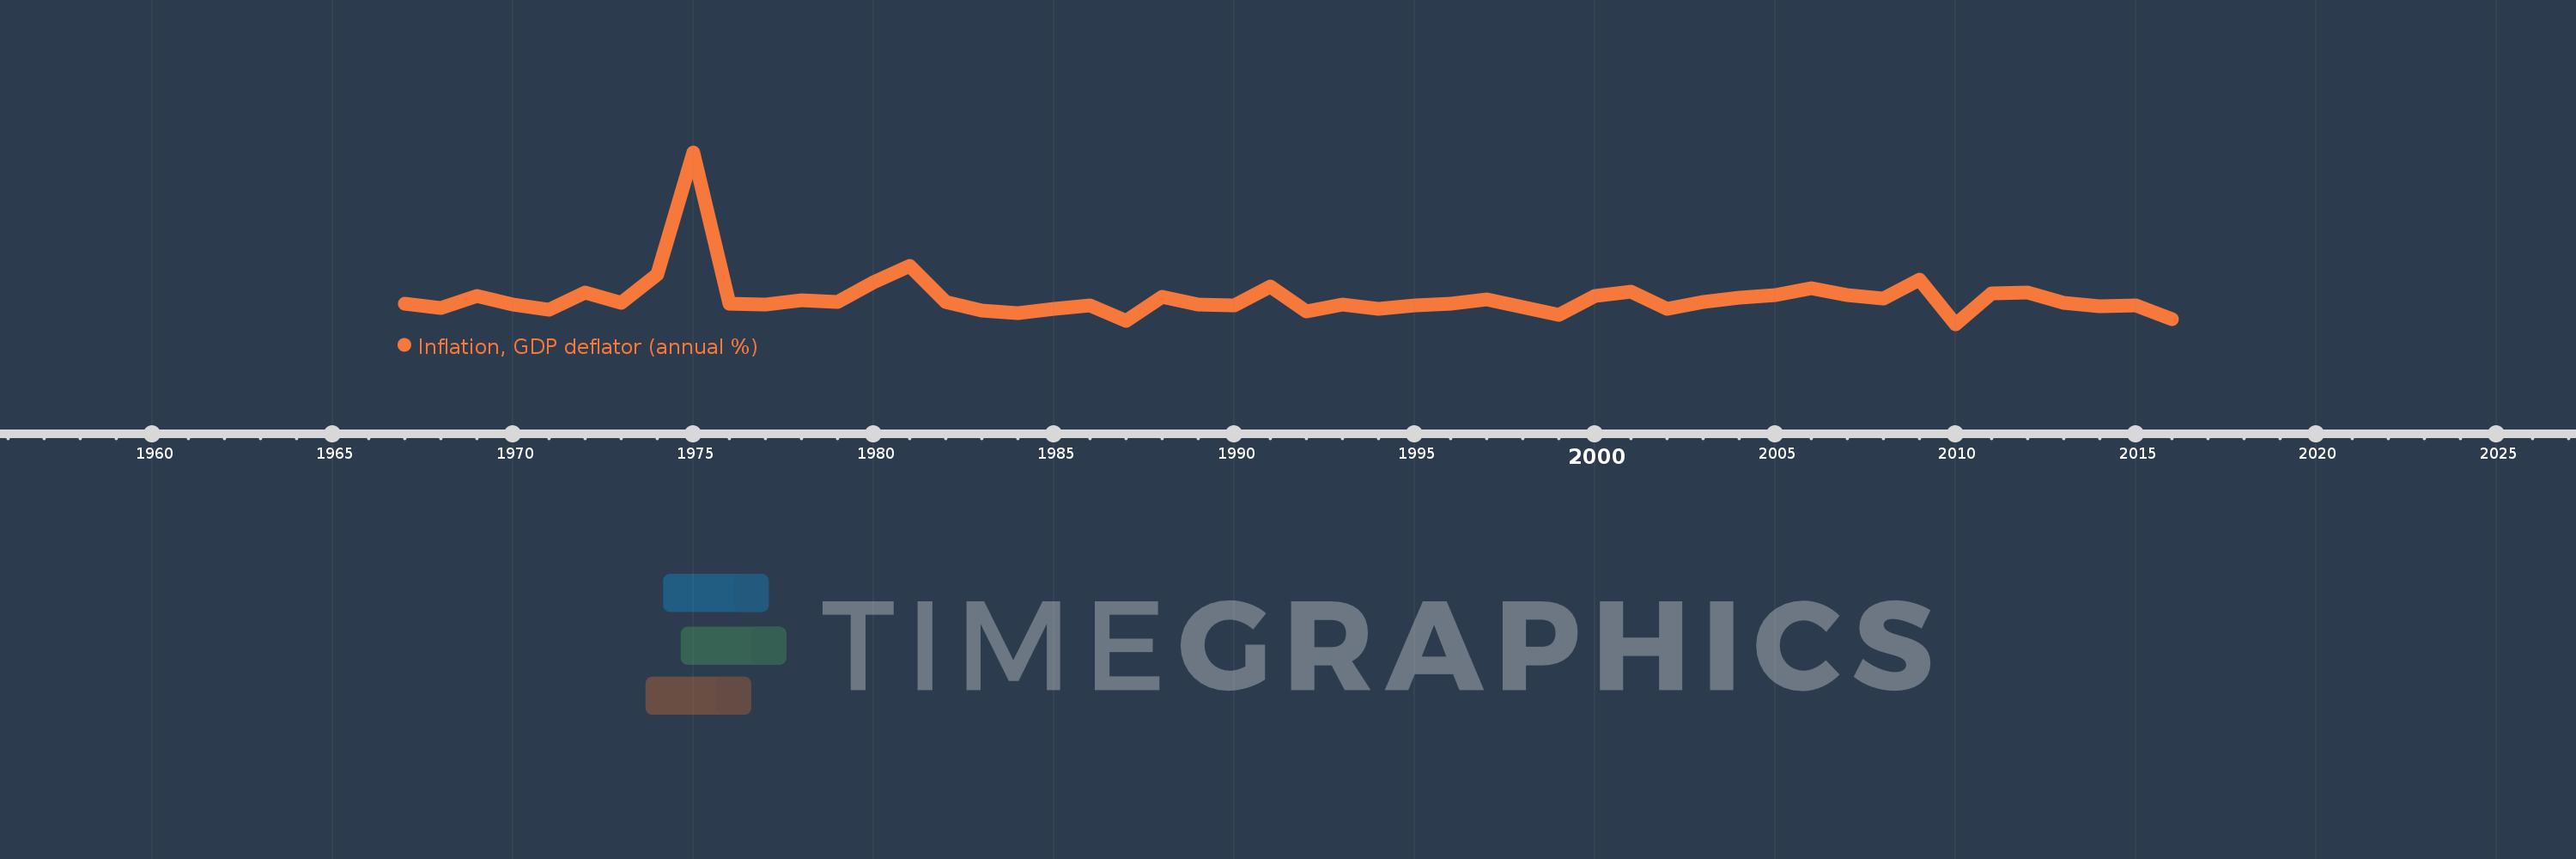
Inflation, GDP deflator (annual %)
2016,2015,2014,2013,2012,2011,2010,2009,2008,2007,2006,2005,2004,2003,2002,2001,2000,1999,1998,1997,1996,1995,1994,1993,1992,1991,1990,1989,1988,1987,1986,1985,1984,1983,1982,1981,1980,1979,1978,1977,1976,1975,1974,1973,1972,1971,1970,1969,1968,1967
This statistics in other country:
AfghanistanAlbaniaAlgeriaAndorraAngolaAntigua and BarbudaArab WorldArgentinaArmeniaArubaAustraliaAustriaAzerbaijanBahamas, TheBahrainBangladeshBarbadosBelarusBelgiumBelizeBeninBermudaBhutanBoliviaBosnia and HerzegovinaBotswanaBrazilBrunei DarussalamBulgariaBurkina FasoBurundiCabo VerdeCambodiaCameroonCanadaCaribbean small statesCayman IslandsCentral African RepublicCentral Europe and the BalticsChadChannel IslandsChileChinaColombiaComorosCongo, Dem. Rep.Congo, Rep.Costa RicaCote d'IvoireCroatiaCubaCyprusCzech RepublicDenmarkDjiboutiDominicaDominican RepublicEarly-demographic dividendEast Asia & PacificEast Asia & Pacific (excluding high income)East Asia & Pacific (IDA & IBRD countries)EcuadorEgypt, Arab Rep.El SalvadorEquatorial GuineaEritreaEstoniaEthiopiaEuro areaEurope & Central AsiaEurope & Central Asia (excluding high income)Europe & Central Asia (IDA & IBRD countries)European UnionFijiFinlandFragile and conflict affected situationsFranceFrench PolynesiaGabonGambia, TheGeorgiaGermanyGhanaGreeceGreenlandGrenadaGuatemalaGuineaGuinea-BissauGuyanaHaitiHeavily indebted poor countries (HIPC)High incomeHondurasHong Kong SAR, ChinaHungaryIBRD onlyIcelandIDA & IBRD totalIDA blendIDA onlyIDA totalIndiaIndonesiaIran, Islamic Rep.IraqIrelandIsle of ManIsraelItalyJamaicaJapanJordanKazakhstanKenyaKiribatiKorea, Rep.KosovoKuwaitKyrgyz RepublicLao PDRLate-demographic dividendLatin America & Caribbean Latin America & Caribbean (excluding high income)Latin America & the Caribbean (IDA & IBRD countries)LatviaLeast developed countries: UN classificationLebanonLesothoLiberiaLibyaLiechtensteinLithuaniaLow & middle incomeLow incomeLower middle incomeLuxembourgMacao SAR, ChinaMacedonia, FYRMadagascarMalawiMalaysiaMaldivesMaliMaltaMarshall IslandsMauritaniaMauritiusMexicoMicronesia, Fed. Sts.Middle East & North AfricaMiddle East & North Africa (excluding high income)Middle East & North Africa (IDA & IBRD countries)Middle incomeMoldovaMonacoMongoliaMontenegroMoroccoMozambiqueMyanmarNamibiaNauruNepalNetherlandsNew CaledoniaNew ZealandNicaraguaNigerNigeriaNorth AmericaNorwayOECD membersOmanOther small statesPacific island small statesPakistanPalauPanamaPapua New GuineaParaguayPeruPhilippinesPolandPortugalPost-demographic dividendPre-demographic dividendPuerto RicoQatarRomaniaRussian FederationRwandaSamoaSan MarinoSao Tome and PrincipeSaudi ArabiaSenegalSerbiaSeychellesSierra LeoneSingaporeSlovak RepublicSloveniaSmall statesSolomon IslandsSomaliaSouth AfricaSouth AsiaSouth Asia (IDA & IBRD)South SudanSpainSri LankaSt. Kitts and NevisSt. LuciaSt. Vincent and the GrenadinesSub-Saharan Africa Sub-Saharan Africa (excluding high income)Sub-Saharan Africa (IDA & IBRD countries)SudanSurinameSwazilandSwedenSwitzerlandSyrian Arab RepublicTajikistanTanzaniaThailandTimor-LesteTogoTongaTrinidad and TobagoTunisiaTurkeyTurkmenistanTuvaluUgandaUkraineUnited Arab EmiratesUnited KingdomUnited StatesUpper middle incomeUruguayUzbekistanVanuatuVenezuela, RBVietnamVirgin Islands (U.S.)West Bank and GazaWorldYemen, Rep.ZambiaZimbabwe Timeline:
This timeline shows a graph from 1967 to 2016 of Oman. No data until 1966. Number of actual observations by date: 50.
Source name:
World Development Indicators
Source organization:
World Bank national accounts data, and OECD National Accounts data files.
Categories, topics:
Economy & Growth
Last updated:
apr 23, 2017
Indicators value changes by year
Minimum:
-25.128
jan 1, 2010
Maximum:
200.986
jan 1, 1975
At the date of observation
Value
Absolute change
Change from previous value
jan 1, 1967
1.782
+1.782
0.0%
jan 1, 1968
-3.543
-5.325
-298.75%
jan 1, 1969
11.517
+15.059
-425.09%
jan 1, 1970
1.113
-10.404
-90.34%
jan 1, 1971
-6.23
-7.342
-659.72%
jan 1, 1972
16.092
+22.322
-358.32%
jan 1, 1973
2.481
-13.611
-84.58%
jan 1, 1974
40.309
+37.829
1.52K%
jan 1, 1975
200.986
+160.677
398.61%
jan 1, 1976
2.374
-198.612
-98.82%
jan 1, 1977
1.3
-1.074
-45.24%
jan 1, 1978
6.0
+4.7
361.54%
jan 1, 1979
3.802
-2.198
-36.63%
jan 1, 1980
30.582
+26.78
704.31%
jan 1, 1981
51.105
+20.523
67.11%
jan 1, 1982
3.68
-47.425
-92.8%
jan 1, 1983
-6.72
-10.4
-282.62%
jan 1, 1984
-9.999
-3.279
48.79%
jan 1, 1985
-4.718
+5.281
-52.81%
jan 1, 1986
-0.512
+4.206
-89.15%
jan 1, 1987
-20.635
-20.123
3.93K%
jan 1, 1988
11.178
+31.813
-154.17%
jan 1, 1989
1.319
-9.859
-88.2%
jan 1, 1990
0.0
-1.319
-100.0%
jan 1, 1991
24.841
+24.841
-8.98 bln%
jan 1, 1992
-8.498
-33.339
-134.21%
jan 1, 1993
1.273
+9.771
-114.98%
jan 1, 1994
-5.389
-6.662
-523.33%
jan 1, 1995
-0.45
+4.939
-91.64%
jan 1, 1996
1.756
+2.207
-489.87%
jan 1, 1997
7.416
+5.66
322.27%
jan 1, 1998
-2.235
-9.651
-130.14%
jan 1, 1999
-13.352
-11.117
497.36%
jan 1, 2000
11.675
+25.027
-187.43%
jan 1, 2001
17.808
+6.133
52.53%
jan 1, 2002
-4.562
-22.369
-125.62%
jan 1, 2003
4.703
+9.265
-203.1%
jan 1, 2004
10.347
+5.644
120.0%
jan 1, 2005
13.007
+2.659
25.7%
jan 1, 2006
22.465
+9.458
72.71%
jan 1, 2007
13.63
-8.834
-39.33%
jan 1, 2008
8.264
-5.367
-39.37%
jan 1, 2009
33.752
+25.488
308.43%
jan 1, 2010
-25.128
-58.88
-174.45%
jan 1, 2011
15.635
+40.763
-162.22%
jan 1, 2012
17.15
+1.514
9.68%
jan 1, 2013
3.246
-13.903
-81.07%
jan 1, 2014
-1.379
-4.625
-142.47%
jan 1, 2015
0.11
+1.489
-107.98%
jan 1, 2016
-18.437
-18.547
-16.87K%
Ranking of countries by current statistics by years


Comments: