29
/
en
AIzaSyAYiBZKx7MnpbEhh9jyipgxe19OcubqV5w
April 1, 2024
48221
Middle East & North Africa
MEA
false
2
1
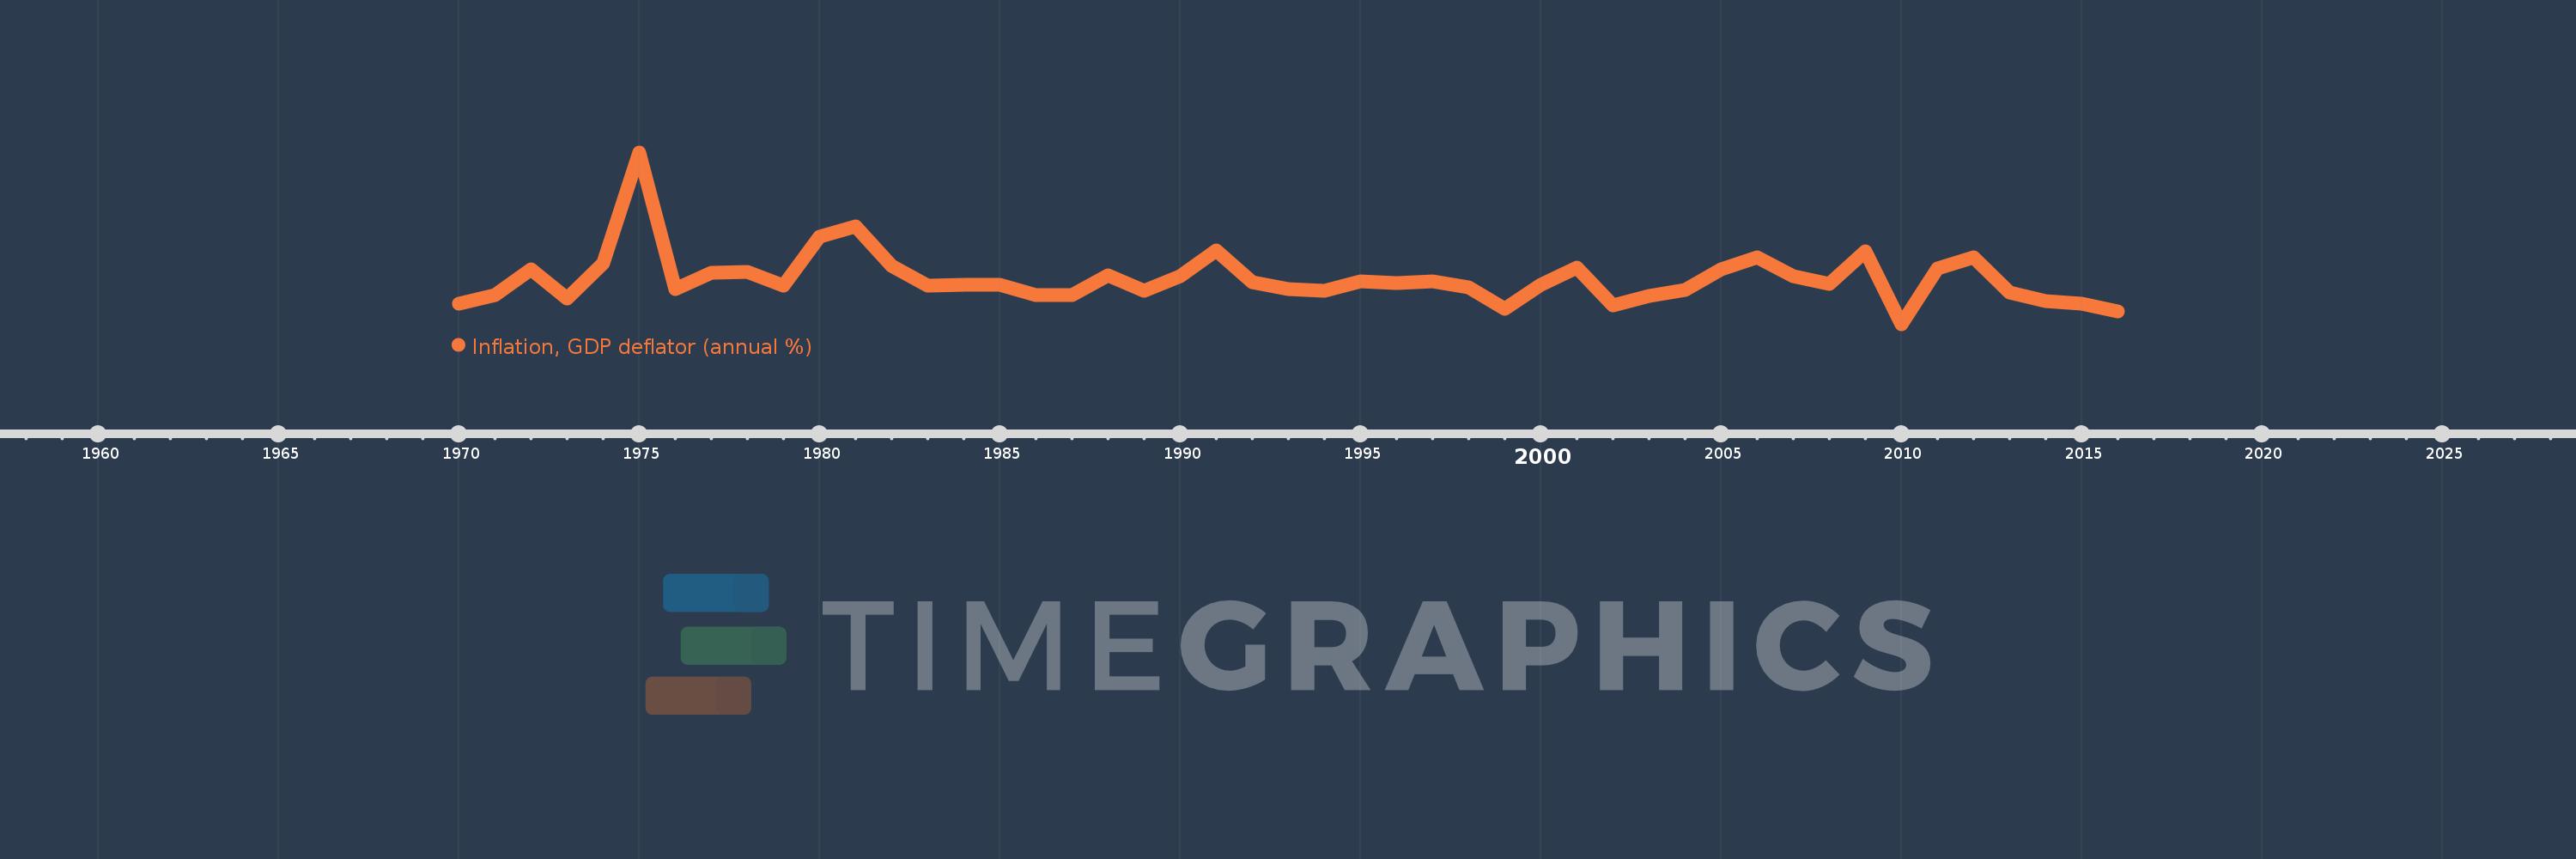
Inflation, GDP deflator (annual %)
2016,2015,2014,2013,2012,2011,2010,2009,2008,2007,2006,2005,2004,2003,2002,2001,2000,1999,1998,1997,1996,1995,1994,1993,1992,1991,1990,1989,1988,1987,1986,1985,1984,1983,1982,1981,1980,1979,1978,1977,1976,1975,1974,1973,1972,1971,1970
This statistics in other country:
AfghanistanAlbaniaAlgeriaAndorraAngolaAntigua and BarbudaArab WorldArgentinaArmeniaArubaAustraliaAustriaAzerbaijanBahamas, TheBahrainBangladeshBarbadosBelarusBelgiumBelizeBeninBermudaBhutanBoliviaBosnia and HerzegovinaBotswanaBrazilBrunei DarussalamBulgariaBurkina FasoBurundiCabo VerdeCambodiaCameroonCanadaCaribbean small statesCayman IslandsCentral African RepublicCentral Europe and the BalticsChadChannel IslandsChileChinaColombiaComorosCongo, Dem. Rep.Congo, Rep.Costa RicaCote d'IvoireCroatiaCubaCyprusCzech RepublicDenmarkDjiboutiDominicaDominican RepublicEarly-demographic dividendEast Asia & PacificEast Asia & Pacific (excluding high income)East Asia & Pacific (IDA & IBRD countries)EcuadorEgypt, Arab Rep.El SalvadorEquatorial GuineaEritreaEstoniaEthiopiaEuro areaEurope & Central AsiaEurope & Central Asia (excluding high income)Europe & Central Asia (IDA & IBRD countries)European UnionFijiFinlandFragile and conflict affected situationsFranceFrench PolynesiaGabonGambia, TheGeorgiaGermanyGhanaGreeceGreenlandGrenadaGuatemalaGuineaGuinea-BissauGuyanaHaitiHeavily indebted poor countries (HIPC)High incomeHondurasHong Kong SAR, ChinaHungaryIBRD onlyIcelandIDA & IBRD totalIDA blendIDA onlyIDA totalIndiaIndonesiaIran, Islamic Rep.IraqIrelandIsle of ManIsraelItalyJamaicaJapanJordanKazakhstanKenyaKiribatiKorea, Rep.KosovoKuwaitKyrgyz RepublicLao PDRLate-demographic dividendLatin America & Caribbean Latin America & Caribbean (excluding high income)Latin America & the Caribbean (IDA & IBRD countries)LatviaLeast developed countries: UN classificationLebanonLesothoLiberiaLibyaLiechtensteinLithuaniaLow & middle incomeLow incomeLower middle incomeLuxembourgMacao SAR, ChinaMacedonia, FYRMadagascarMalawiMalaysiaMaldivesMaliMaltaMarshall IslandsMauritaniaMauritiusMexicoMicronesia, Fed. Sts.Middle East & North AfricaMiddle East & North Africa (excluding high income)Middle East & North Africa (IDA & IBRD countries)Middle incomeMoldovaMonacoMongoliaMontenegroMoroccoMozambiqueMyanmarNamibiaNauruNepalNetherlandsNew CaledoniaNew ZealandNicaraguaNigerNigeriaNorth AmericaNorwayOECD membersOmanOther small statesPacific island small statesPakistanPalauPanamaPapua New GuineaParaguayPeruPhilippinesPolandPortugalPost-demographic dividendPre-demographic dividendPuerto RicoQatarRomaniaRussian FederationRwandaSamoaSan MarinoSao Tome and PrincipeSaudi ArabiaSenegalSerbiaSeychellesSierra LeoneSingaporeSlovak RepublicSloveniaSmall statesSolomon IslandsSomaliaSouth AfricaSouth AsiaSouth Asia (IDA & IBRD)South SudanSpainSri LankaSt. Kitts and NevisSt. LuciaSt. Vincent and the GrenadinesSub-Saharan Africa Sub-Saharan Africa (excluding high income)Sub-Saharan Africa (IDA & IBRD countries)SudanSurinameSwazilandSwedenSwitzerlandSyrian Arab RepublicTajikistanTanzaniaThailandTimor-LesteTogoTongaTrinidad and TobagoTunisiaTurkeyTurkmenistanTuvaluUgandaUkraineUnited Arab EmiratesUnited KingdomUnited StatesUpper middle incomeUruguayUzbekistanVanuatuVenezuela, RBVietnamVirgin Islands (U.S.)West Bank and GazaWorldYemen, Rep.ZambiaZimbabwe Timeline:
This timeline shows a graph from 1970 to 2016 of Middle East & North Africa. No data until 1969. Number of actual observations by date: 47.
Source name:
World Development Indicators
Source organization:
World Bank national accounts data, and OECD National Accounts data files.
Categories, topics:
Economy & Growth
Last updated:
apr 23, 2017
Indicators value changes by year
Minimum:
-4.366
jan 1, 2010
Maximum:
41.982
jan 1, 1975
At the date of observation
Value
Absolute change
Change from previous value
jan 1, 1970
1.227
+1.227
0.0%
jan 1, 1971
3.468
+2.241
182.66%
jan 1, 1972
10.34
+6.872
198.17%
jan 1, 1973
2.496
-7.843
-75.86%
jan 1, 1974
12.125
+9.629
385.76%
jan 1, 1975
41.982
+29.858
246.25%
jan 1, 1976
5.179
-36.803
-87.66%
jan 1, 1977
9.512
+4.333
83.66%
jan 1, 1978
9.79
+0.278
2.92%
jan 1, 1979
5.925
-3.865
-39.48%
jan 1, 1980
19.218
+13.293
224.34%
jan 1, 1981
21.946
+2.728
14.2%
jan 1, 1982
11.411
-10.535
-48.01%
jan 1, 1983
6.056
-5.355
-46.93%
jan 1, 1984
6.172
+0.116
1.92%
jan 1, 1985
6.201
+0.029
0.47%
jan 1, 1986
3.597
-2.604
-41.99%
jan 1, 1987
3.518
-0.079
-2.21%
jan 1, 1988
8.842
+5.324
151.36%
jan 1, 1989
4.684
-4.158
-47.02%
jan 1, 1990
8.615
+3.931
83.92%
jan 1, 1991
15.502
+6.886
79.93%
jan 1, 1992
7.037
-8.465
-54.61%
jan 1, 1993
5.119
-1.918
-27.25%
jan 1, 1994
4.546
-0.573
-11.2%
jan 1, 1995
7.104
+2.558
56.28%
jan 1, 1996
6.684
-0.42
-5.91%
jan 1, 1997
7.106
+0.422
6.31%
jan 1, 1998
5.588
-1.517
-21.36%
jan 1, 1999
-0.299
-5.888
-105.36%
jan 1, 2000
6.258
+6.558
-2.19K%
jan 1, 2001
10.951
+4.693
74.99%
jan 1, 2002
0.78
-10.171
-92.88%
jan 1, 2003
3.185
+2.406
308.51%
jan 1, 2004
4.925
+1.739
54.6%
jan 1, 2005
10.371
+5.446
110.59%
jan 1, 2006
13.735
+3.364
32.44%
jan 1, 2007
8.626
-5.109
-37.2%
jan 1, 2008
6.395
-2.23
-25.86%
jan 1, 2009
15.319
+8.923
139.53%
jan 1, 2010
-4.366
-19.684
-128.5%
jan 1, 2011
10.559
+14.925
-341.87%
jan 1, 2012
13.591
+3.032
28.71%
jan 1, 2013
4.194
-9.397
-69.14%
jan 1, 2014
1.86
-2.334
-55.64%
jan 1, 2015
1.112
-0.749
-40.25%
jan 1, 2016
-0.998
-2.11
-189.81%
Ranking of countries by current statistics by years


Comments: