29
/
en
AIzaSyAYiBZKx7MnpbEhh9jyipgxe19OcubqV5w
April 1, 2024
127478
Equatorial Guinea
GNQ
true
2
1
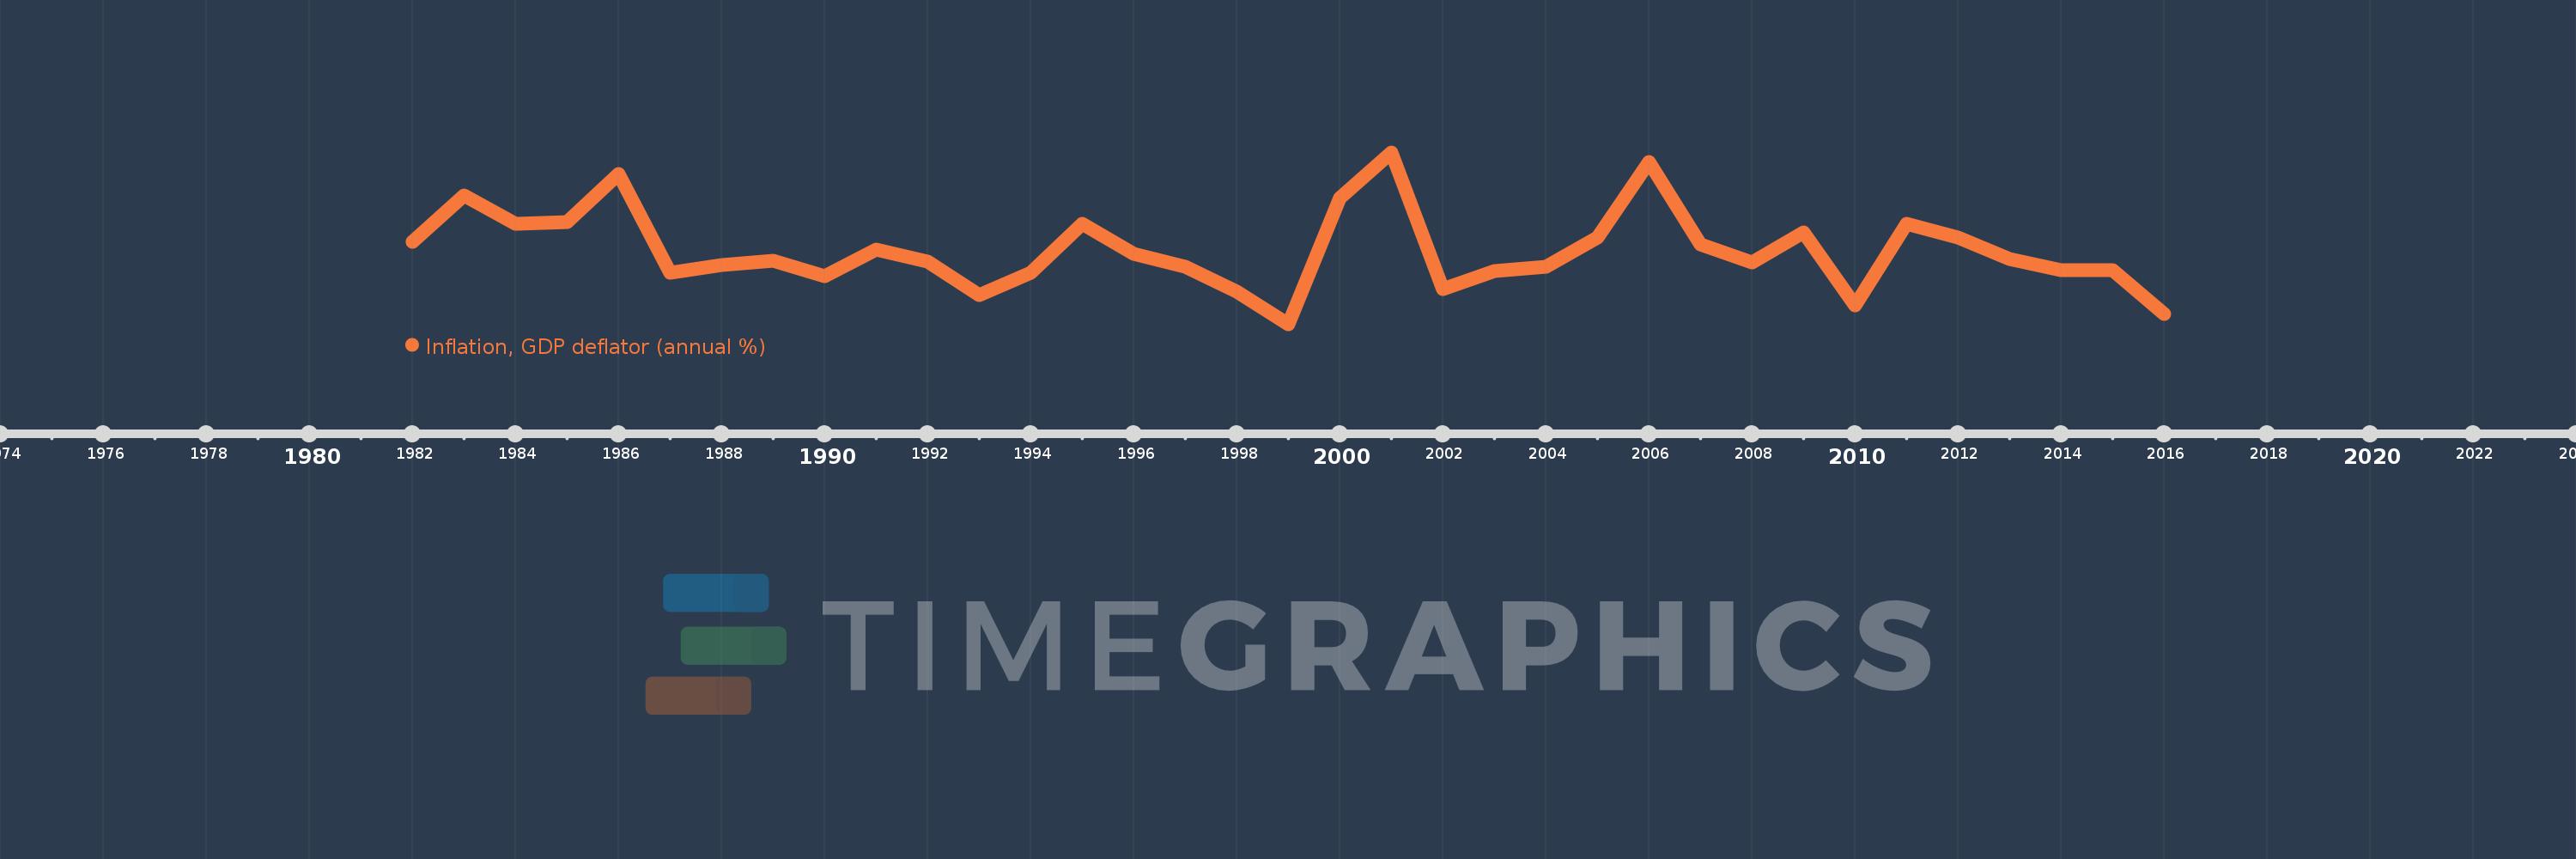
Inflation, GDP deflator (annual %)
2016,2015,2014,2013,2012,2011,2010,2009,2008,2007,2006,2005,2004,2003,2002,2001,2000,1999,1998,1997,1996,1995,1994,1993,1992,1991,1990,1989,1988,1987,1986,1985,1984,1983,1982
This statistics in other country:
AfghanistanAlbaniaAlgeriaAndorraAngolaAntigua and BarbudaArab WorldArgentinaArmeniaArubaAustraliaAustriaAzerbaijanBahamas, TheBahrainBangladeshBarbadosBelarusBelgiumBelizeBeninBermudaBhutanBoliviaBosnia and HerzegovinaBotswanaBrazilBrunei DarussalamBulgariaBurkina FasoBurundiCabo VerdeCambodiaCameroonCanadaCaribbean small statesCayman IslandsCentral African RepublicCentral Europe and the BalticsChadChannel IslandsChileChinaColombiaComorosCongo, Dem. Rep.Congo, Rep.Costa RicaCote d'IvoireCroatiaCubaCyprusCzech RepublicDenmarkDjiboutiDominicaDominican RepublicEarly-demographic dividendEast Asia & PacificEast Asia & Pacific (excluding high income)East Asia & Pacific (IDA & IBRD countries)EcuadorEgypt, Arab Rep.El SalvadorEquatorial GuineaEritreaEstoniaEthiopiaEuro areaEurope & Central AsiaEurope & Central Asia (excluding high income)Europe & Central Asia (IDA & IBRD countries)European UnionFijiFinlandFragile and conflict affected situationsFranceFrench PolynesiaGabonGambia, TheGeorgiaGermanyGhanaGreeceGreenlandGrenadaGuatemalaGuineaGuinea-BissauGuyanaHaitiHeavily indebted poor countries (HIPC)High incomeHondurasHong Kong SAR, ChinaHungaryIBRD onlyIcelandIDA & IBRD totalIDA blendIDA onlyIDA totalIndiaIndonesiaIran, Islamic Rep.IraqIrelandIsle of ManIsraelItalyJamaicaJapanJordanKazakhstanKenyaKiribatiKorea, Rep.KosovoKuwaitKyrgyz RepublicLao PDRLate-demographic dividendLatin America & Caribbean Latin America & Caribbean (excluding high income)Latin America & the Caribbean (IDA & IBRD countries)LatviaLeast developed countries: UN classificationLebanonLesothoLiberiaLibyaLiechtensteinLithuaniaLow & middle incomeLow incomeLower middle incomeLuxembourgMacao SAR, ChinaMacedonia, FYRMadagascarMalawiMalaysiaMaldivesMaliMaltaMarshall IslandsMauritaniaMauritiusMexicoMicronesia, Fed. Sts.Middle East & North AfricaMiddle East & North Africa (excluding high income)Middle East & North Africa (IDA & IBRD countries)Middle incomeMoldovaMonacoMongoliaMontenegroMoroccoMozambiqueMyanmarNamibiaNauruNepalNetherlandsNew CaledoniaNew ZealandNicaraguaNigerNigeriaNorth AmericaNorwayOECD membersOmanOther small statesPacific island small statesPakistanPalauPanamaPapua New GuineaParaguayPeruPhilippinesPolandPortugalPost-demographic dividendPre-demographic dividendPuerto RicoQatarRomaniaRussian FederationRwandaSamoaSan MarinoSao Tome and PrincipeSaudi ArabiaSenegalSerbiaSeychellesSierra LeoneSingaporeSlovak RepublicSloveniaSmall statesSolomon IslandsSomaliaSouth AfricaSouth AsiaSouth Asia (IDA & IBRD)South SudanSpainSri LankaSt. Kitts and NevisSt. LuciaSt. Vincent and the GrenadinesSub-Saharan Africa Sub-Saharan Africa (excluding high income)Sub-Saharan Africa (IDA & IBRD countries)SudanSurinameSwazilandSwedenSwitzerlandSyrian Arab RepublicTajikistanTanzaniaThailandTimor-LesteTogoTongaTrinidad and TobagoTunisiaTurkeyTurkmenistanTuvaluUgandaUkraineUnited Arab EmiratesUnited KingdomUnited StatesUpper middle incomeUruguayUzbekistanVanuatuVenezuela, RBVietnamVirgin Islands (U.S.)West Bank and GazaWorldYemen, Rep.ZambiaZimbabwe Timeline:
This timeline shows a graph from 1982 to 2016 of Equatorial Guinea. No data until 1981. Number of actual observations by date: 35.
Source name:
World Development Indicators
Source organization:
World Bank national accounts data, and OECD National Accounts data files.
Categories, topics:
Economy & Growth
Last updated:
apr 23, 2017
Indicators value changes by year
Minimum:
-31.566
jan 1, 1999
Maximum:
64.735
jan 1, 2001
At the date of observation
Value
Absolute change
Change from previous value
jan 1, 1982
14.443
+14.443
0.0%
jan 1, 1983
40.418
+25.975
179.85%
jan 1, 1984
24.75
-15.668
-38.77%
jan 1, 1985
25.637
+0.887
3.59%
jan 1, 1986
52.775
+27.138
105.85%
jan 1, 1987
-2.923
-55.698
-105.54%
jan 1, 1988
1.518
+4.442
-151.93%
jan 1, 1989
3.977
+2.459
161.96%
jan 1, 1990
-4.796
-8.773
-220.59%
jan 1, 1991
10.353
+15.148
-315.86%
jan 1, 1992
3.552
-6.8
-65.69%
jan 1, 1993
-15.424
-18.976
-534.21%
jan 1, 1994
-2.693
+12.731
-82.54%
jan 1, 1995
24.526
+27.219
-1.01K%
jan 1, 1996
7.681
-16.846
-68.68%
jan 1, 1997
0.821
-6.86
-89.31%
jan 1, 1998
-13.147
-13.968
-1.7K%
jan 1, 1999
-31.566
-18.419
140.1%
jan 1, 2000
39.158
+70.724
-224.05%
jan 1, 2001
64.735
+25.577
65.32%
jan 1, 2002
-11.972
-76.707
-118.49%
jan 1, 2003
-1.583
+10.389
-86.78%
jan 1, 2004
0.636
+2.219
-140.16%
jan 1, 2005
16.923
+16.287
2.56K%
jan 1, 2006
59.329
+42.406
250.59%
jan 1, 2007
12.976
-46.353
-78.13%
jan 1, 2008
3.038
-9.939
-76.59%
jan 1, 2009
19.84
+16.802
553.14%
jan 1, 2010
-20.83
-40.67
-204.99%
jan 1, 2011
24.907
+45.737
-219.57%
jan 1, 2012
17.045
-7.861
-31.56%
jan 1, 2013
4.855
-12.19
-71.52%
jan 1, 2014
-1.073
-5.927
-122.1%
jan 1, 2015
-1.449
-0.376
35.04%
jan 1, 2016
-25.842
-24.393
1.68K%
Ranking of countries by current statistics by years


Comments: