29
/
en
AIzaSyAYiBZKx7MnpbEhh9jyipgxe19OcubqV5w
April 1, 2024
162712
Jamaica
JAM
true
2
1
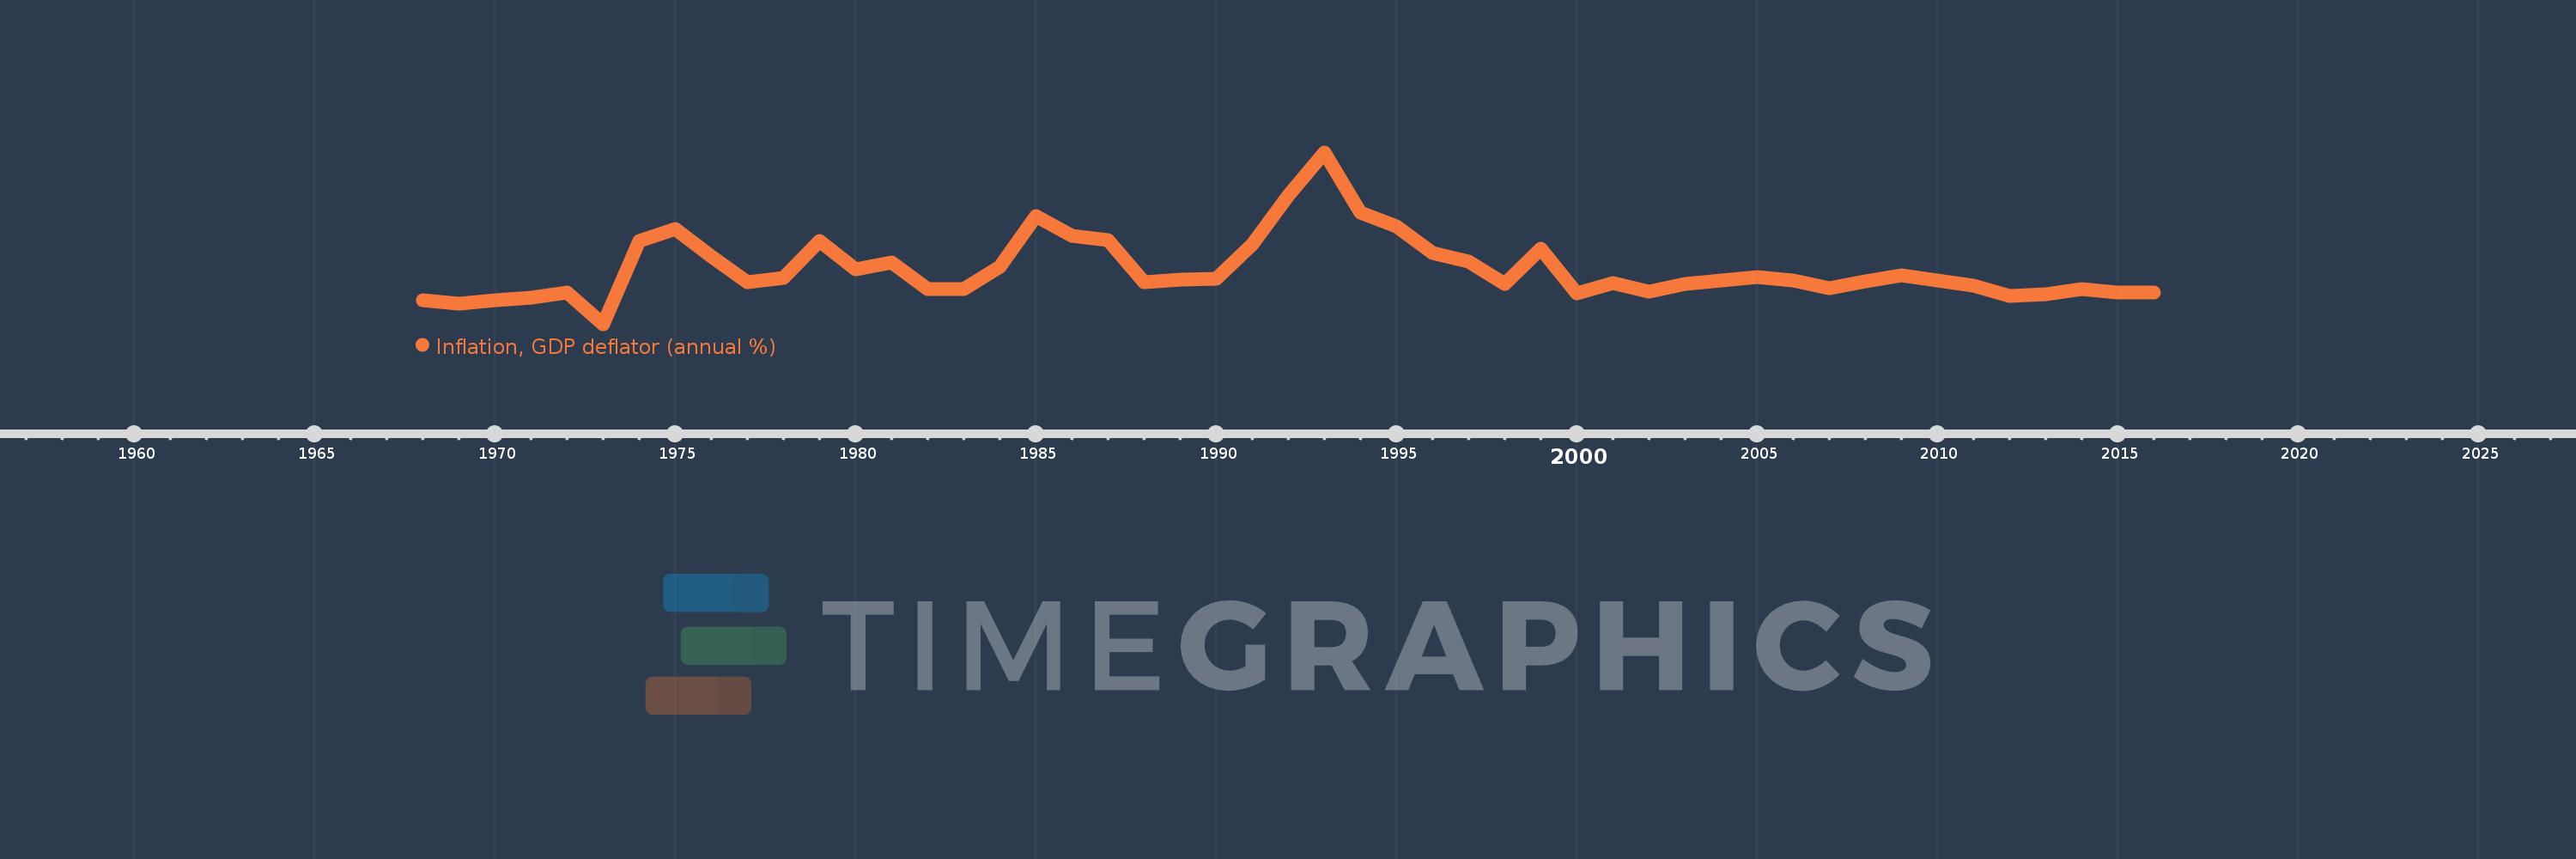
Inflation, GDP deflator (annual %)
2016,2015,2014,2013,2012,2011,2010,2009,2008,2007,2006,2005,2004,2003,2002,2001,2000,1999,1998,1997,1996,1995,1994,1993,1992,1991,1990,1989,1988,1987,1986,1985,1984,1983,1982,1981,1980,1979,1978,1977,1976,1975,1974,1973,1972,1971,1970,1969,1968
This statistics in other country:
AfghanistanAlbaniaAlgeriaAndorraAngolaAntigua and BarbudaArab WorldArgentinaArmeniaArubaAustraliaAustriaAzerbaijanBahamas, TheBahrainBangladeshBarbadosBelarusBelgiumBelizeBeninBermudaBhutanBoliviaBosnia and HerzegovinaBotswanaBrazilBrunei DarussalamBulgariaBurkina FasoBurundiCabo VerdeCambodiaCameroonCanadaCaribbean small statesCayman IslandsCentral African RepublicCentral Europe and the BalticsChadChannel IslandsChileChinaColombiaComorosCongo, Dem. Rep.Congo, Rep.Costa RicaCote d'IvoireCroatiaCubaCyprusCzech RepublicDenmarkDjiboutiDominicaDominican RepublicEarly-demographic dividendEast Asia & PacificEast Asia & Pacific (excluding high income)East Asia & Pacific (IDA & IBRD countries)EcuadorEgypt, Arab Rep.El SalvadorEquatorial GuineaEritreaEstoniaEthiopiaEuro areaEurope & Central AsiaEurope & Central Asia (excluding high income)Europe & Central Asia (IDA & IBRD countries)European UnionFijiFinlandFragile and conflict affected situationsFranceFrench PolynesiaGabonGambia, TheGeorgiaGermanyGhanaGreeceGreenlandGrenadaGuatemalaGuineaGuinea-BissauGuyanaHaitiHeavily indebted poor countries (HIPC)High incomeHondurasHong Kong SAR, ChinaHungaryIBRD onlyIcelandIDA & IBRD totalIDA blendIDA onlyIDA totalIndiaIndonesiaIran, Islamic Rep.IraqIrelandIsle of ManIsraelItalyJamaicaJapanJordanKazakhstanKenyaKiribatiKorea, Rep.KosovoKuwaitKyrgyz RepublicLao PDRLate-demographic dividendLatin America & Caribbean Latin America & Caribbean (excluding high income)Latin America & the Caribbean (IDA & IBRD countries)LatviaLeast developed countries: UN classificationLebanonLesothoLiberiaLibyaLiechtensteinLithuaniaLow & middle incomeLow incomeLower middle incomeLuxembourgMacao SAR, ChinaMacedonia, FYRMadagascarMalawiMalaysiaMaldivesMaliMaltaMarshall IslandsMauritaniaMauritiusMexicoMicronesia, Fed. Sts.Middle East & North AfricaMiddle East & North Africa (excluding high income)Middle East & North Africa (IDA & IBRD countries)Middle incomeMoldovaMonacoMongoliaMontenegroMoroccoMozambiqueMyanmarNamibiaNauruNepalNetherlandsNew CaledoniaNew ZealandNicaraguaNigerNigeriaNorth AmericaNorwayOECD membersOmanOther small statesPacific island small statesPakistanPalauPanamaPapua New GuineaParaguayPeruPhilippinesPolandPortugalPost-demographic dividendPre-demographic dividendPuerto RicoQatarRomaniaRussian FederationRwandaSamoaSan MarinoSao Tome and PrincipeSaudi ArabiaSenegalSerbiaSeychellesSierra LeoneSingaporeSlovak RepublicSloveniaSmall statesSolomon IslandsSomaliaSouth AfricaSouth AsiaSouth Asia (IDA & IBRD)South SudanSpainSri LankaSt. Kitts and NevisSt. LuciaSt. Vincent and the GrenadinesSub-Saharan Africa Sub-Saharan Africa (excluding high income)Sub-Saharan Africa (IDA & IBRD countries)SudanSurinameSwazilandSwedenSwitzerlandSyrian Arab RepublicTajikistanTanzaniaThailandTimor-LesteTogoTongaTrinidad and TobagoTunisiaTurkeyTurkmenistanTuvaluUgandaUkraineUnited Arab EmiratesUnited KingdomUnited StatesUpper middle incomeUruguayUzbekistanVanuatuVenezuela, RBVietnamVirgin Islands (U.S.)West Bank and GazaWorldYemen, Rep.ZambiaZimbabwe Timeline:
This timeline shows a graph from 1968 to 2016 of Jamaica. No data until 1967. Number of actual observations by date: 49.
Source name:
World Development Indicators
Source organization:
World Bank national accounts data, and OECD National Accounts data files.
Categories, topics:
Economy & Growth
Last updated:
apr 23, 2017
Indicators value changes by year
Minimum:
-4.906
jan 1, 1973
Maximum:
60.036
jan 1, 1993
At the date of observation
Value
Absolute change
Change from previous value
jan 1, 1968
4.242
+4.242
0.0%
jan 1, 1969
2.735
-1.507
-35.53%
jan 1, 1970
4.106
+1.371
50.13%
jan 1, 1971
5.226
+1.12
27.29%
jan 1, 1972
6.922
+1.697
32.46%
jan 1, 1973
-4.906
-11.828
-170.87%
jan 1, 1974
26.449
+31.354
-639.13%
jan 1, 1975
31.086
+4.638
17.53%
jan 1, 1976
20.743
-10.343
-33.27%
jan 1, 1977
11.131
-9.612
-46.34%
jan 1, 1978
12.486
+1.355
12.18%
jan 1, 1979
26.575
+14.089
112.83%
jan 1, 1980
15.737
-10.838
-40.78%
jan 1, 1981
18.288
+2.551
16.21%
jan 1, 1982
8.324
-9.964
-54.48%
jan 1, 1983
8.315
-0.01
-0.11%
jan 1, 1984
16.961
+8.646
103.98%
jan 1, 1985
35.919
+18.959
111.78%
jan 1, 1986
28.529
-7.39
-20.57%
jan 1, 1987
26.861
-1.668
-5.85%
jan 1, 1988
10.823
-16.039
-59.71%
jan 1, 1989
12.056
+1.233
11.39%
jan 1, 1990
12.369
+0.314
2.6%
jan 1, 1991
25.117
+12.748
103.06%
jan 1, 1992
43.842
+18.725
74.55%
jan 1, 1993
60.036
+16.193
36.94%
jan 1, 1994
37.389
-22.646
-37.72%
jan 1, 1995
32.062
-5.328
-14.25%
jan 1, 1996
22.171
-9.89
-30.85%
jan 1, 1997
18.732
-3.44
-15.51%
jan 1, 1998
10.451
-8.281
-44.21%
jan 1, 1999
23.663
+13.212
126.41%
jan 1, 2000
6.789
-16.874
-71.31%
jan 1, 2001
10.596
+3.806
56.06%
jan 1, 2002
7.418
-3.177
-29.99%
jan 1, 2003
10.165
+2.747
37.03%
jan 1, 2004
11.624
+1.459
14.35%
jan 1, 2005
12.859
+1.234
10.62%
jan 1, 2006
11.469
-1.39
-10.81%
jan 1, 2007
8.848
-2.621
-22.85%
jan 1, 2008
11.321
+2.473
27.94%
jan 1, 2009
13.548
+2.227
19.67%
jan 1, 2010
11.644
-1.904
-14.05%
jan 1, 2011
9.818
-1.826
-15.68%
jan 1, 2012
5.77
-4.048
-41.23%
jan 1, 2013
6.581
+0.811
14.06%
jan 1, 2014
8.388
+1.807
27.46%
jan 1, 2015
6.987
-1.402
-16.71%
jan 1, 2016
7.072
+0.085
1.22%
Ranking of countries by current statistics by years


Comments: