29
/
en
AIzaSyAYiBZKx7MnpbEhh9jyipgxe19OcubqV5w
April 1, 2024
134892
French Polynesia
PYF
true
2
1
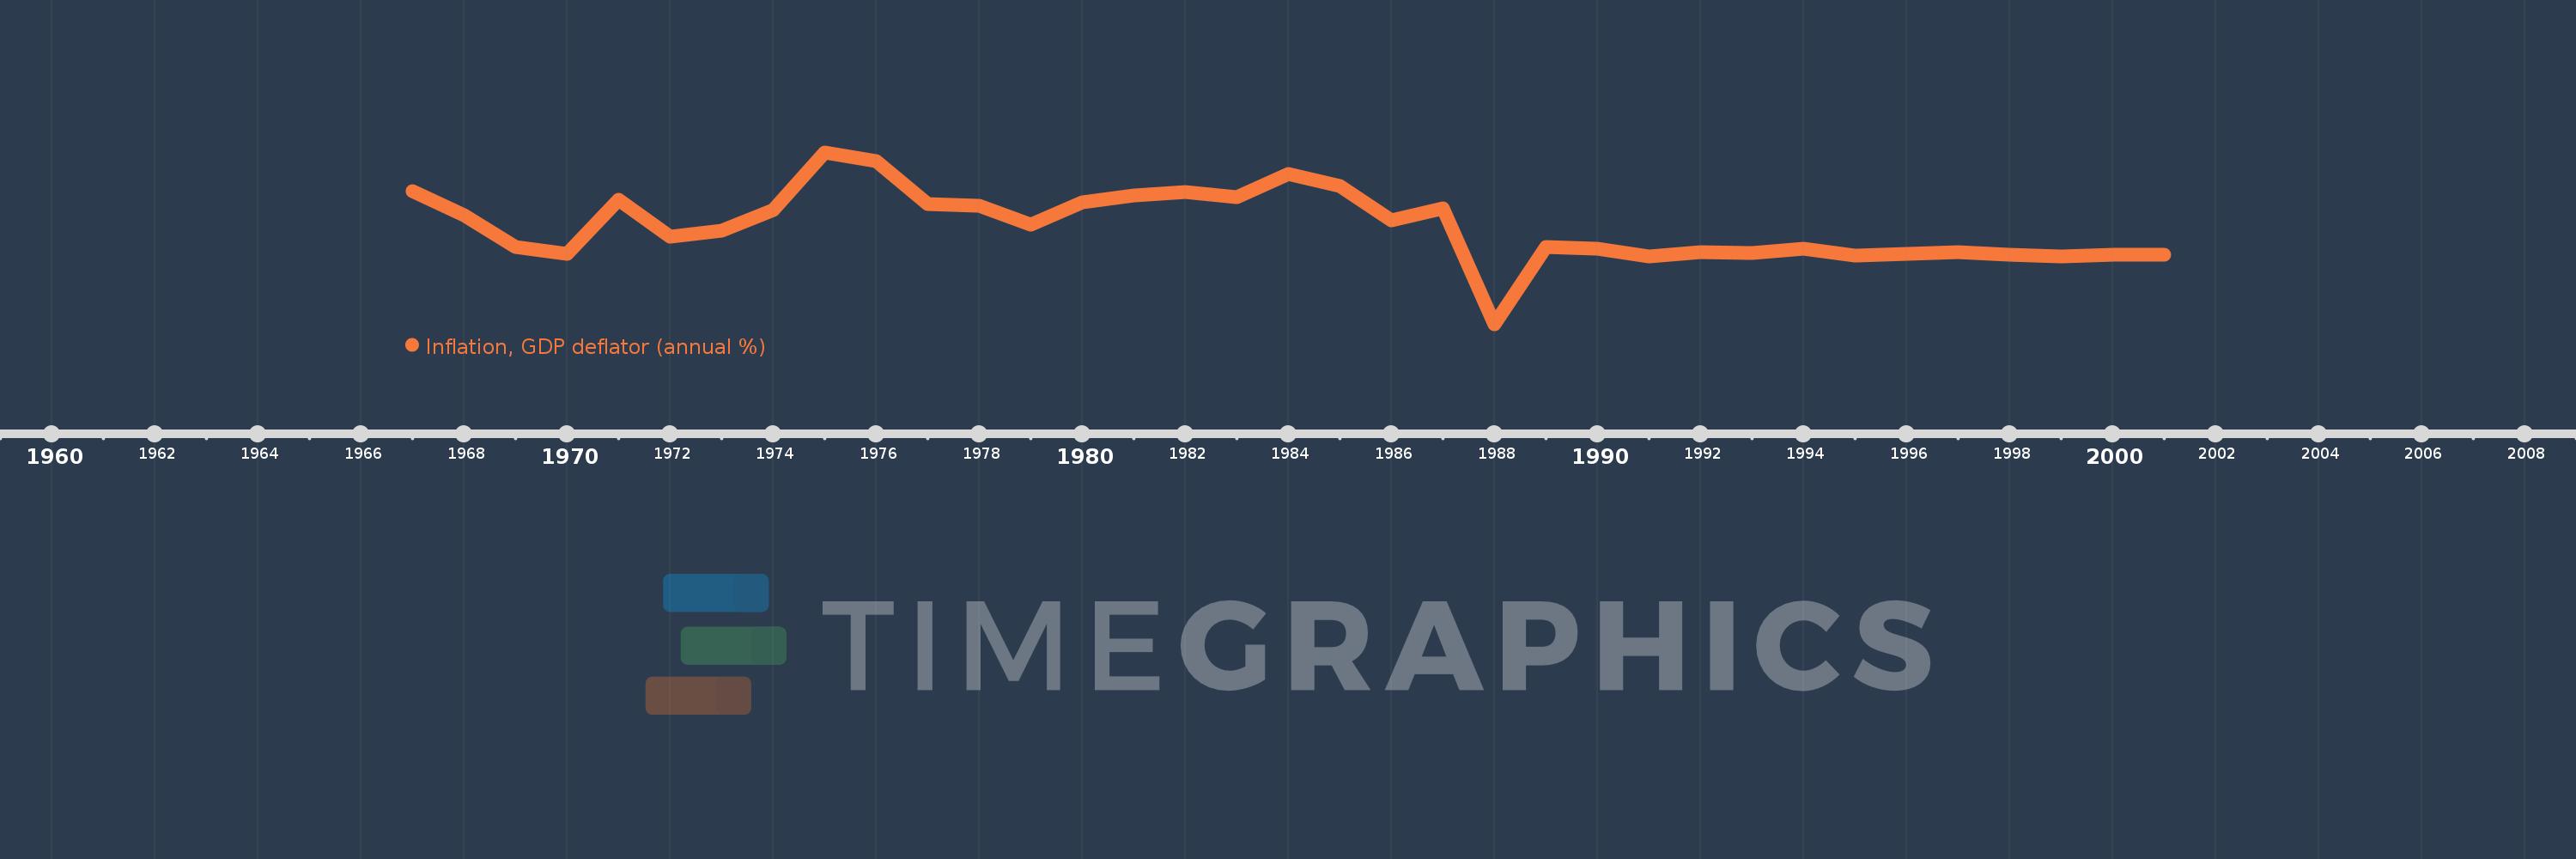
Inflation, GDP deflator (annual %)
2001,2000,1999,1998,1997,1996,1995,1994,1993,1992,1991,1990,1989,1988,1987,1986,1985,1984,1983,1982,1981,1980,1979,1978,1977,1976,1975,1974,1973,1972,1971,1970,1969,1968,1967
This statistics in other country:
AfghanistanAlbaniaAlgeriaAndorraAngolaAntigua and BarbudaArab WorldArgentinaArmeniaArubaAustraliaAustriaAzerbaijanBahamas, TheBahrainBangladeshBarbadosBelarusBelgiumBelizeBeninBermudaBhutanBoliviaBosnia and HerzegovinaBotswanaBrazilBrunei DarussalamBulgariaBurkina FasoBurundiCabo VerdeCambodiaCameroonCanadaCaribbean small statesCayman IslandsCentral African RepublicCentral Europe and the BalticsChadChannel IslandsChileChinaColombiaComorosCongo, Dem. Rep.Congo, Rep.Costa RicaCote d'IvoireCroatiaCubaCyprusCzech RepublicDenmarkDjiboutiDominicaDominican RepublicEarly-demographic dividendEast Asia & PacificEast Asia & Pacific (excluding high income)East Asia & Pacific (IDA & IBRD countries)EcuadorEgypt, Arab Rep.El SalvadorEquatorial GuineaEritreaEstoniaEthiopiaEuro areaEurope & Central AsiaEurope & Central Asia (excluding high income)Europe & Central Asia (IDA & IBRD countries)European UnionFijiFinlandFragile and conflict affected situationsFranceFrench PolynesiaGabonGambia, TheGeorgiaGermanyGhanaGreeceGreenlandGrenadaGuatemalaGuineaGuinea-BissauGuyanaHaitiHeavily indebted poor countries (HIPC)High incomeHondurasHong Kong SAR, ChinaHungaryIBRD onlyIcelandIDA & IBRD totalIDA blendIDA onlyIDA totalIndiaIndonesiaIran, Islamic Rep.IraqIrelandIsle of ManIsraelItalyJamaicaJapanJordanKazakhstanKenyaKiribatiKorea, Rep.KosovoKuwaitKyrgyz RepublicLao PDRLate-demographic dividendLatin America & Caribbean Latin America & Caribbean (excluding high income)Latin America & the Caribbean (IDA & IBRD countries)LatviaLeast developed countries: UN classificationLebanonLesothoLiberiaLibyaLiechtensteinLithuaniaLow & middle incomeLow incomeLower middle incomeLuxembourgMacao SAR, ChinaMacedonia, FYRMadagascarMalawiMalaysiaMaldivesMaliMaltaMarshall IslandsMauritaniaMauritiusMexicoMicronesia, Fed. Sts.Middle East & North AfricaMiddle East & North Africa (excluding high income)Middle East & North Africa (IDA & IBRD countries)Middle incomeMoldovaMonacoMongoliaMontenegroMoroccoMozambiqueMyanmarNamibiaNauruNepalNetherlandsNew CaledoniaNew ZealandNicaraguaNigerNigeriaNorth AmericaNorwayOECD membersOmanOther small statesPacific island small statesPakistanPalauPanamaPapua New GuineaParaguayPeruPhilippinesPolandPortugalPost-demographic dividendPre-demographic dividendPuerto RicoQatarRomaniaRussian FederationRwandaSamoaSan MarinoSao Tome and PrincipeSaudi ArabiaSenegalSerbiaSeychellesSierra LeoneSingaporeSlovak RepublicSloveniaSmall statesSolomon IslandsSomaliaSouth AfricaSouth AsiaSouth Asia (IDA & IBRD)South SudanSpainSri LankaSt. Kitts and NevisSt. LuciaSt. Vincent and the GrenadinesSub-Saharan Africa Sub-Saharan Africa (excluding high income)Sub-Saharan Africa (IDA & IBRD countries)SudanSurinameSwazilandSwedenSwitzerlandSyrian Arab RepublicTajikistanTanzaniaThailandTimor-LesteTogoTongaTrinidad and TobagoTunisiaTurkeyTurkmenistanTuvaluUgandaUkraineUnited Arab EmiratesUnited KingdomUnited StatesUpper middle incomeUruguayUzbekistanVanuatuVenezuela, RBVietnamVirgin Islands (U.S.)West Bank and GazaWorldYemen, Rep.ZambiaZimbabwe Timeline:
This timeline shows a graph from 1967 to 2001 of French Polynesia. No data until 1966. Number of actual observations by date: 35.
Source name:
World Development Indicators
Source organization:
World Bank national accounts data, and OECD National Accounts data files.
Categories, topics:
Economy & Growth
Last updated:
apr 23, 2017
Indicators value changes by year
Minimum:
-10.466
jan 1, 1988
Maximum:
17.852
jan 1, 1975
At the date of observation
Value
Absolute change
Change from previous value
jan 1, 1967
11.486
+11.486
0.0%
jan 1, 1968
7.567
-3.919
-34.12%
jan 1, 1969
2.209
-5.358
-70.8%
jan 1, 1970
1.179
-1.03
-46.63%
jan 1, 1971
10.023
+8.844
749.99%
jan 1, 1972
4.031
-5.991
-59.78%
jan 1, 1973
5.014
+0.983
24.39%
jan 1, 1974
8.38
+3.366
67.12%
jan 1, 1975
17.852
+9.472
113.03%
jan 1, 1976
16.383
-1.469
-8.23%
jan 1, 1977
9.307
-7.076
-43.19%
jan 1, 1978
9.1
-0.207
-2.23%
jan 1, 1979
5.96
-3.14
-34.51%
jan 1, 1980
9.602
+3.642
61.11%
jan 1, 1981
10.812
+1.21
12.6%
jan 1, 1982
11.38
+0.568
5.26%
jan 1, 1983
10.523
-0.857
-7.53%
jan 1, 1984
14.247
+3.725
35.4%
jan 1, 1985
12.299
-1.948
-13.68%
jan 1, 1986
6.607
-5.692
-46.28%
jan 1, 1987
8.589
+1.982
30.0%
jan 1, 1988
-10.466
-19.055
-221.85%
jan 1, 1989
2.276
+12.743
-121.75%
jan 1, 1990
2.01
-0.267
-11.73%
jan 1, 1991
0.764
-1.245
-61.96%
jan 1, 1992
1.45
+0.686
89.72%
jan 1, 1993
1.272
-0.179
-12.32%
jan 1, 1994
2.003
+0.731
57.51%
jan 1, 1995
0.867
-1.136
-56.7%
jan 1, 1996
1.142
+0.274
31.62%
jan 1, 1997
1.468
+0.327
28.63%
jan 1, 1998
0.984
-0.484
-32.98%
jan 1, 1999
0.726
-0.258
-26.23%
jan 1, 2000
0.931
+0.205
28.2%
jan 1, 2001
0.962
+0.031
3.32%
Ranking of countries by current statistics by years


Comments: