29
/
en
AIzaSyAYiBZKx7MnpbEhh9jyipgxe19OcubqV5w
April 1, 2024
216583
Pakistan
PAK
true
2
1
Inflation, GDP deflator (annual %)
2016,2015,2014,2013,2012,2011,2010,2009,2008,2007,2006,2005,2004,2003,2002,2001,2000,1999,1998,1997,1996,1995,1994,1993,1992,1991,1990,1989,1988,1987,1986,1985,1984,1983,1982,1981,1980,1979,1978,1977,1976,1975,1974,1973,1972,1971,1970,1969,1968,1967,1966,1965,1964,1963,1962
This statistics in other country:
AfghanistanAlbaniaAlgeriaAndorraAngolaAntigua and BarbudaArab WorldArgentinaArmeniaArubaAustraliaAustriaAzerbaijanBahamas, TheBahrainBangladeshBarbadosBelarusBelgiumBelizeBeninBermudaBhutanBoliviaBosnia and HerzegovinaBotswanaBrazilBrunei DarussalamBulgariaBurkina FasoBurundiCabo VerdeCambodiaCameroonCanadaCaribbean small statesCayman IslandsCentral African RepublicCentral Europe and the BalticsChadChannel IslandsChileChinaColombiaComorosCongo, Dem. Rep.Congo, Rep.Costa RicaCote d'IvoireCroatiaCubaCyprusCzech RepublicDenmarkDjiboutiDominicaDominican RepublicEarly-demographic dividendEast Asia & PacificEast Asia & Pacific (excluding high income)East Asia & Pacific (IDA & IBRD countries)EcuadorEgypt, Arab Rep.El SalvadorEquatorial GuineaEritreaEstoniaEthiopiaEuro areaEurope & Central AsiaEurope & Central Asia (excluding high income)Europe & Central Asia (IDA & IBRD countries)European UnionFijiFinlandFragile and conflict affected situationsFranceFrench PolynesiaGabonGambia, TheGeorgiaGermanyGhanaGreeceGreenlandGrenadaGuatemalaGuineaGuinea-BissauGuyanaHaitiHeavily indebted poor countries (HIPC)High incomeHondurasHong Kong SAR, ChinaHungaryIBRD onlyIcelandIDA & IBRD totalIDA blendIDA onlyIDA totalIndiaIndonesiaIran, Islamic Rep.IraqIrelandIsle of ManIsraelItalyJamaicaJapanJordanKazakhstanKenyaKiribatiKorea, Rep.KosovoKuwaitKyrgyz RepublicLao PDRLate-demographic dividendLatin America & Caribbean Latin America & Caribbean (excluding high income)Latin America & the Caribbean (IDA & IBRD countries)LatviaLeast developed countries: UN classificationLebanonLesothoLiberiaLibyaLiechtensteinLithuaniaLow & middle incomeLow incomeLower middle incomeLuxembourgMacao SAR, ChinaMacedonia, FYRMadagascarMalawiMalaysiaMaldivesMaliMaltaMarshall IslandsMauritaniaMauritiusMexicoMicronesia, Fed. Sts.Middle East & North AfricaMiddle East & North Africa (excluding high income)Middle East & North Africa (IDA & IBRD countries)Middle incomeMoldovaMonacoMongoliaMontenegroMoroccoMozambiqueMyanmarNamibiaNauruNepalNetherlandsNew CaledoniaNew ZealandNicaraguaNigerNigeriaNorth AmericaNorwayOECD membersOmanOther small statesPacific island small statesPakistanPalauPanamaPapua New GuineaParaguayPeruPhilippinesPolandPortugalPost-demographic dividendPre-demographic dividendPuerto RicoQatarRomaniaRussian FederationRwandaSamoaSan MarinoSao Tome and PrincipeSaudi ArabiaSenegalSerbiaSeychellesSierra LeoneSingaporeSlovak RepublicSloveniaSmall statesSolomon IslandsSomaliaSouth AfricaSouth AsiaSouth Asia (IDA & IBRD)South SudanSpainSri LankaSt. Kitts and NevisSt. LuciaSt. Vincent and the GrenadinesSub-Saharan Africa Sub-Saharan Africa (excluding high income)Sub-Saharan Africa (IDA & IBRD countries)SudanSurinameSwazilandSwedenSwitzerlandSyrian Arab RepublicTajikistanTanzaniaThailandTimor-LesteTogoTongaTrinidad and TobagoTunisiaTurkeyTurkmenistanTuvaluUgandaUkraineUnited Arab EmiratesUnited KingdomUnited StatesUpper middle incomeUruguayUzbekistanVanuatuVenezuela, RBVietnamVirgin Islands (U.S.)West Bank and GazaWorldYemen, Rep.ZambiaZimbabwe Timeline:
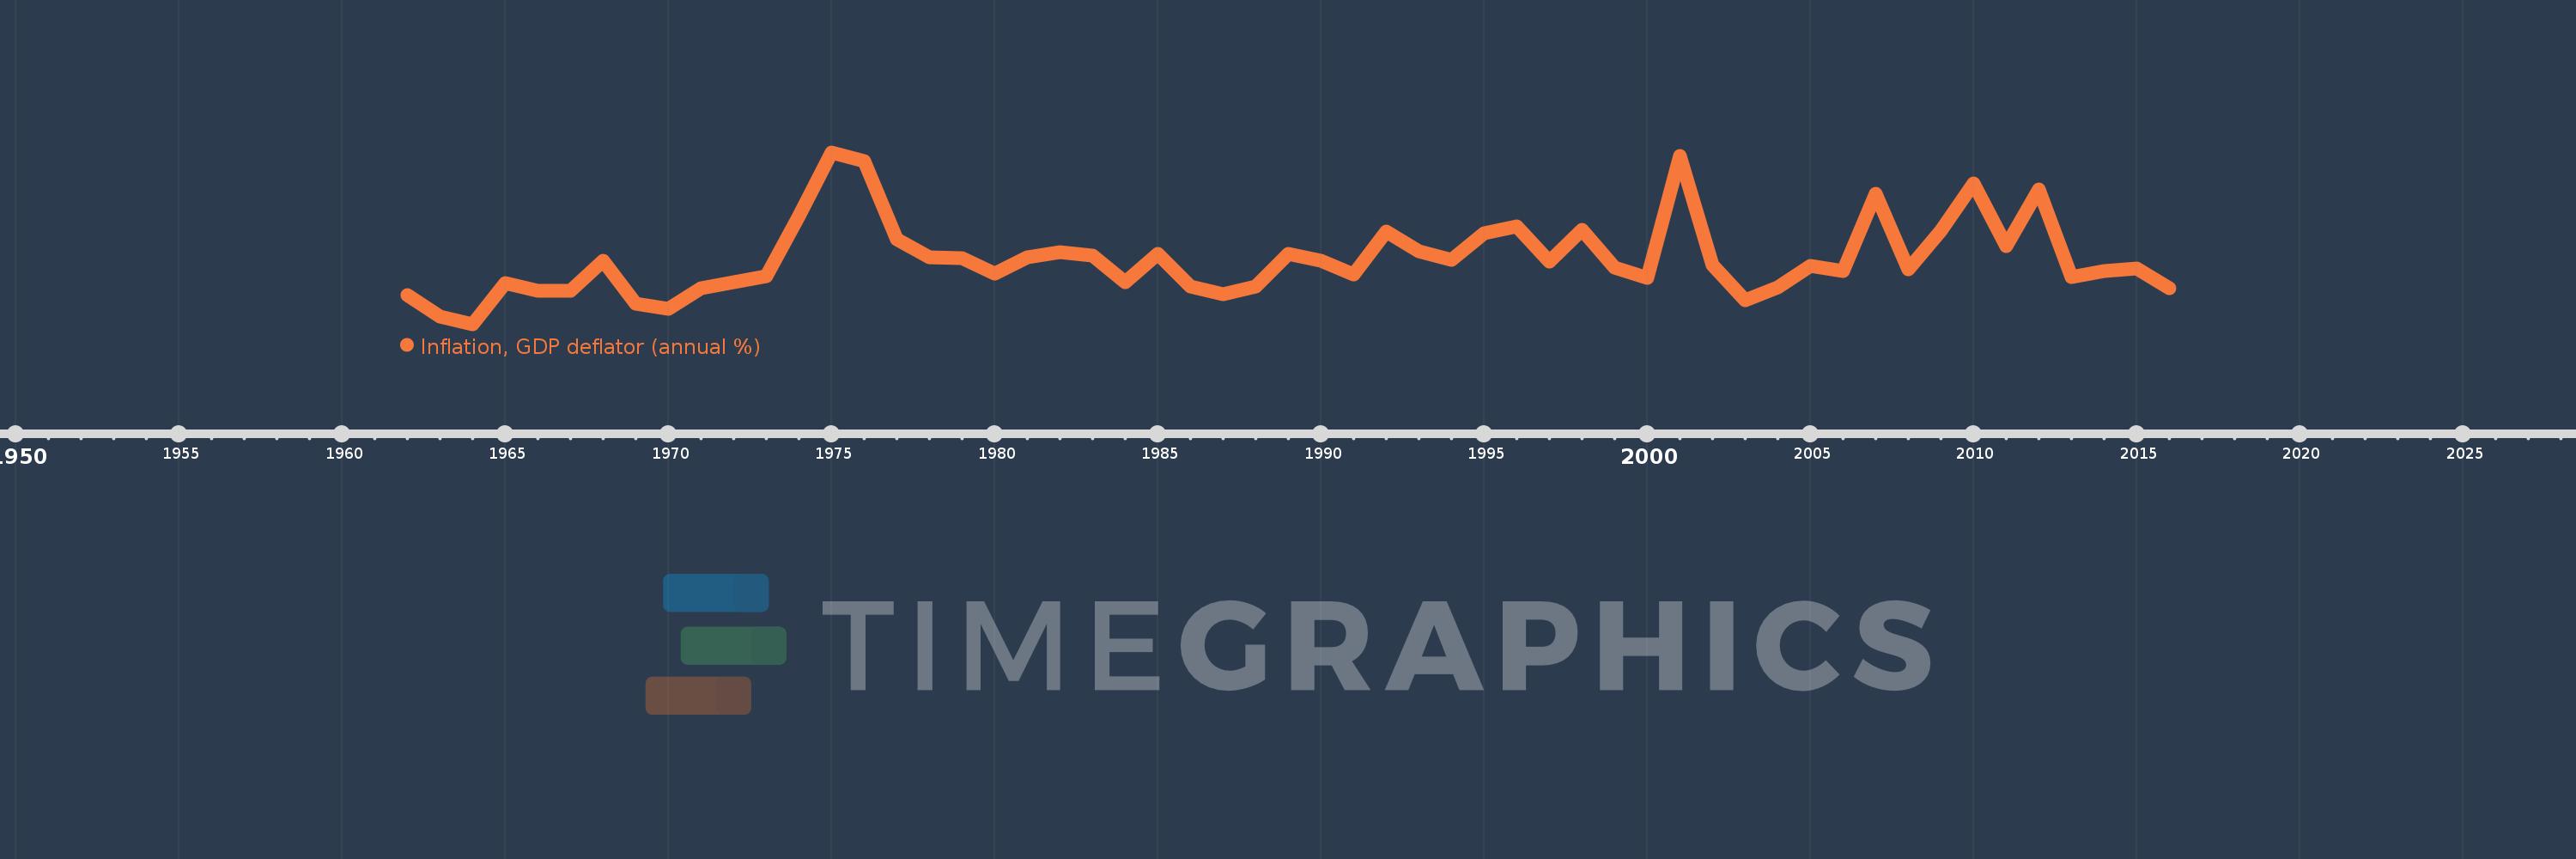
This timeline shows a graph from 1962 to 2016 of Pakistan. No data until 1961. Number of actual observations by date: 55.
Source name:
World Development Indicators
Source organization:
World Bank national accounts data, and OECD National Accounts data files.
Categories, topics:
Economy & Growth
Last updated:
apr 23, 2017
Indicators value changes by year
Minimum:
-1.312
jan 1, 1964
Maximum:
25.437
jan 1, 1975
At the date of observation
Value
Absolute change
Change from previous value
jan 1, 1962
3.196
+3.196
0.0%
jan 1, 1963
-0.077
-3.274
-102.41%
jan 1, 1964
-1.312
-1.235
1.6K%
jan 1, 1965
5.04
+6.352
-484.1%
jan 1, 1966
3.879
-1.161
-23.04%
jan 1, 1967
3.874
-0.005
-0.13%
jan 1, 1968
8.627
+4.753
122.68%
jan 1, 1969
1.899
-6.728
-77.99%
jan 1, 1970
1.139
-0.759
-39.99%
jan 1, 1971
4.307
+3.168
278.04%
jan 1, 1972
5.241
+0.934
21.69%
jan 1, 1973
6.209
+0.968
18.47%
jan 1, 1974
15.544
+9.335
150.33%
jan 1, 1975
25.437
+9.893
63.65%
jan 1, 1976
24.036
-1.401
-5.51%
jan 1, 1977
11.856
-12.18
-50.67%
jan 1, 1978
9.095
-2.761
-23.29%
jan 1, 1979
9.035
-0.06
-0.66%
jan 1, 1980
6.588
-2.447
-27.08%
jan 1, 1981
9.062
+2.474
37.55%
jan 1, 1982
9.914
+0.851
9.4%
jan 1, 1983
9.372
-0.542
-5.47%
jan 1, 1984
5.274
-4.098
-43.72%
jan 1, 1985
9.654
+4.379
83.04%
jan 1, 1986
4.535
-5.119
-53.02%
jan 1, 1987
3.292
-1.243
-27.41%
jan 1, 1988
4.518
+1.226
37.25%
jan 1, 1989
9.618
+5.099
112.86%
jan 1, 1990
8.585
-1.033
-10.74%
jan 1, 1991
6.452
-2.133
-24.85%
jan 1, 1992
13.061
+6.609
102.44%
jan 1, 1993
10.057
-3.004
-23.0%
jan 1, 1994
8.696
-1.361
-13.53%
jan 1, 1995
12.889
+4.193
48.21%
jan 1, 1996
13.875
+0.985
7.64%
jan 1, 1997
8.374
-5.501
-39.65%
jan 1, 1998
13.384
+5.01
59.83%
jan 1, 1999
7.526
-5.857
-43.77%
jan 1, 2000
5.862
-1.664
-22.11%
jan 1, 2001
24.891
+19.029
324.6%
jan 1, 2002
7.891
-17.0
-68.3%
jan 1, 2003
2.463
-5.428
-68.79%
jan 1, 2004
4.438
+1.975
80.2%
jan 1, 2005
7.749
+3.311
74.6%
jan 1, 2006
7.026
-0.723
-9.33%
jan 1, 2007
19.052
+12.026
171.15%
jan 1, 2008
7.274
-11.778
-61.82%
jan 1, 2009
13.204
+5.93
81.52%
jan 1, 2010
20.667
+7.463
56.52%
jan 1, 2011
10.85
-9.816
-47.5%
jan 1, 2012
19.645
+8.794
81.05%
jan 1, 2013
5.969
-13.676
-69.62%
jan 1, 2014
6.966
+0.997
16.71%
jan 1, 2015
7.412
+0.446
6.4%
jan 1, 2016
4.319
-3.093
-41.73%
Ranking of countries by current statistics by years


Comments: