29
/
en
AIzaSyAYiBZKx7MnpbEhh9jyipgxe19OcubqV5w
April 1, 2024
59027
Sub-Saharan Africa
SSF
false
2
1
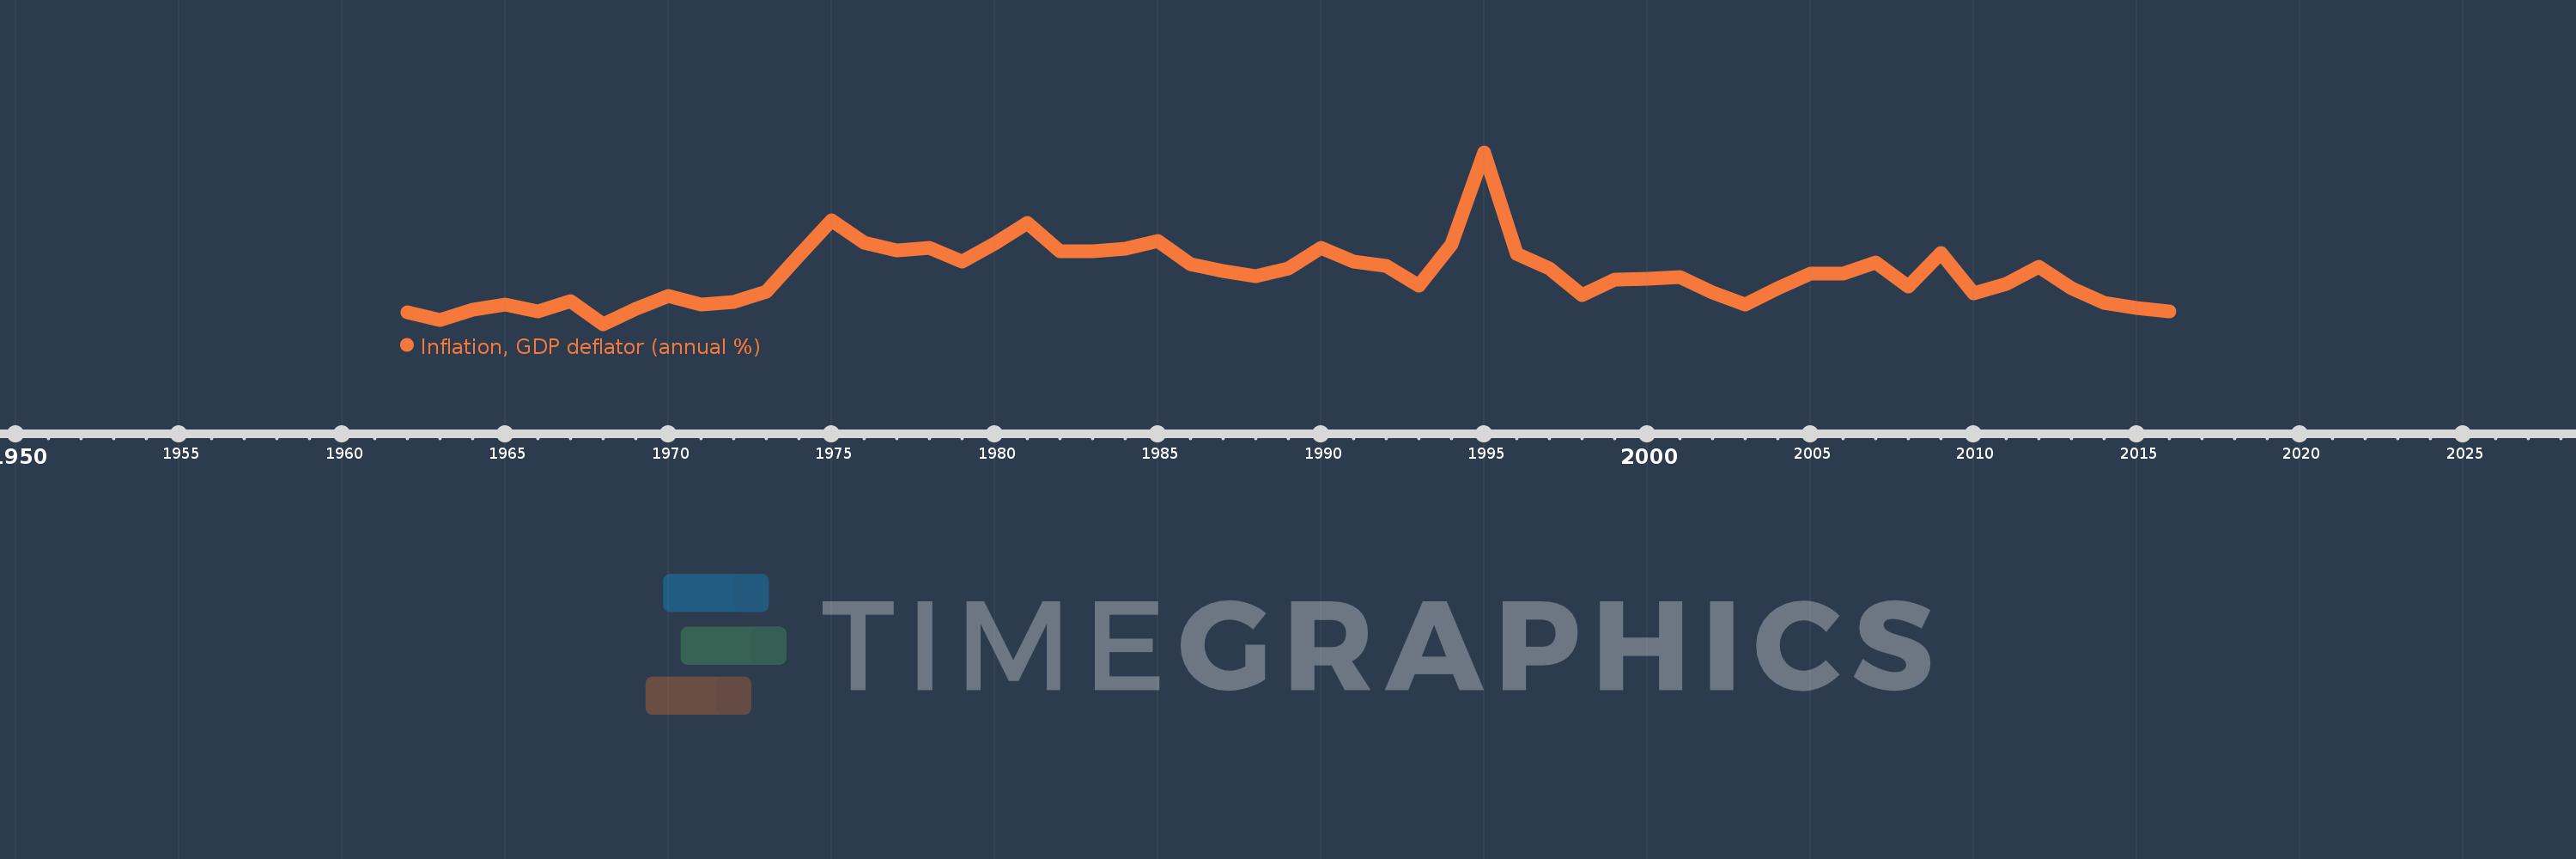
Inflation, GDP deflator (annual %)
2016,2015,2014,2013,2012,2011,2010,2009,2008,2007,2006,2005,2004,2003,2002,2001,2000,1999,1998,1997,1996,1995,1994,1993,1992,1991,1990,1989,1988,1987,1986,1985,1984,1983,1982,1981,1980,1979,1978,1977,1976,1975,1974,1973,1972,1971,1970,1969,1968,1967,1966,1965,1964,1963,1962
This statistics in other country:
AfghanistanAlbaniaAlgeriaAndorraAngolaAntigua and BarbudaArab WorldArgentinaArmeniaArubaAustraliaAustriaAzerbaijanBahamas, TheBahrainBangladeshBarbadosBelarusBelgiumBelizeBeninBermudaBhutanBoliviaBosnia and HerzegovinaBotswanaBrazilBrunei DarussalamBulgariaBurkina FasoBurundiCabo VerdeCambodiaCameroonCanadaCaribbean small statesCayman IslandsCentral African RepublicCentral Europe and the BalticsChadChannel IslandsChileChinaColombiaComorosCongo, Dem. Rep.Congo, Rep.Costa RicaCote d'IvoireCroatiaCubaCyprusCzech RepublicDenmarkDjiboutiDominicaDominican RepublicEarly-demographic dividendEast Asia & PacificEast Asia & Pacific (excluding high income)East Asia & Pacific (IDA & IBRD countries)EcuadorEgypt, Arab Rep.El SalvadorEquatorial GuineaEritreaEstoniaEthiopiaEuro areaEurope & Central AsiaEurope & Central Asia (excluding high income)Europe & Central Asia (IDA & IBRD countries)European UnionFijiFinlandFragile and conflict affected situationsFranceFrench PolynesiaGabonGambia, TheGeorgiaGermanyGhanaGreeceGreenlandGrenadaGuatemalaGuineaGuinea-BissauGuyanaHaitiHeavily indebted poor countries (HIPC)High incomeHondurasHong Kong SAR, ChinaHungaryIBRD onlyIcelandIDA & IBRD totalIDA blendIDA onlyIDA totalIndiaIndonesiaIran, Islamic Rep.IraqIrelandIsle of ManIsraelItalyJamaicaJapanJordanKazakhstanKenyaKiribatiKorea, Rep.KosovoKuwaitKyrgyz RepublicLao PDRLate-demographic dividendLatin America & Caribbean Latin America & Caribbean (excluding high income)Latin America & the Caribbean (IDA & IBRD countries)LatviaLeast developed countries: UN classificationLebanonLesothoLiberiaLibyaLiechtensteinLithuaniaLow & middle incomeLow incomeLower middle incomeLuxembourgMacao SAR, ChinaMacedonia, FYRMadagascarMalawiMalaysiaMaldivesMaliMaltaMarshall IslandsMauritaniaMauritiusMexicoMicronesia, Fed. Sts.Middle East & North AfricaMiddle East & North Africa (excluding high income)Middle East & North Africa (IDA & IBRD countries)Middle incomeMoldovaMonacoMongoliaMontenegroMoroccoMozambiqueMyanmarNamibiaNauruNepalNetherlandsNew CaledoniaNew ZealandNicaraguaNigerNigeriaNorth AmericaNorwayOECD membersOmanOther small statesPacific island small statesPakistanPalauPanamaPapua New GuineaParaguayPeruPhilippinesPolandPortugalPost-demographic dividendPre-demographic dividendPuerto RicoQatarRomaniaRussian FederationRwandaSamoaSan MarinoSao Tome and PrincipeSaudi ArabiaSenegalSerbiaSeychellesSierra LeoneSingaporeSlovak RepublicSloveniaSmall statesSolomon IslandsSomaliaSouth AfricaSouth AsiaSouth Asia (IDA & IBRD)South SudanSpainSri LankaSt. Kitts and NevisSt. LuciaSt. Vincent and the GrenadinesSub-Saharan Africa Sub-Saharan Africa (excluding high income)Sub-Saharan Africa (IDA & IBRD countries)SudanSurinameSwazilandSwedenSwitzerlandSyrian Arab RepublicTajikistanTanzaniaThailandTimor-LesteTogoTongaTrinidad and TobagoTunisiaTurkeyTurkmenistanTuvaluUgandaUkraineUnited Arab EmiratesUnited KingdomUnited StatesUpper middle incomeUruguayUzbekistanVanuatuVenezuela, RBVietnamVirgin Islands (U.S.)West Bank and GazaWorldYemen, Rep.ZambiaZimbabwe Timeline:
This timeline shows a graph from 1962 to 2016 of Sub-Saharan Africa . No data until 1961. Number of actual observations by date: 55.
Source name:
World Development Indicators
Source organization:
World Bank national accounts data, and OECD National Accounts data files.
Categories, topics:
Economy & Growth
Last updated:
apr 23, 2017
Indicators value changes by year
Maximum:
23.249
jan 1, 1995
At the date of observation
Value
Absolute change
Change from previous value
jan 1, 1962
2.729
+2.729
0.0%
jan 1, 1963
1.804
-0.926
-33.91%
jan 1, 1964
3.094
+1.291
71.55%
jan 1, 1965
3.702
+0.608
19.63%
jan 1, 1966
2.889
-0.813
-21.96%
jan 1, 1967
4.139
+1.25
43.26%
jan 1, 1968
1.228
-2.911
-70.34%
jan 1, 1969
3.165
+1.937
157.8%
jan 1, 1970
4.899
+1.734
54.77%
jan 1, 1971
3.785
-1.114
-22.74%
jan 1, 1972
4.126
+0.341
9.01%
jan 1, 1973
5.435
+1.309
31.73%
jan 1, 1974
10.055
+4.62
84.99%
jan 1, 1975
14.541
+4.486
44.61%
jan 1, 1976
11.732
-2.809
-19.32%
jan 1, 1977
10.682
-1.051
-8.95%
jan 1, 1978
11.03
+0.349
3.26%
jan 1, 1979
9.228
-1.802
-16.34%
jan 1, 1980
11.536
+2.307
25.0%
jan 1, 1981
14.246
+2.71
23.49%
jan 1, 1982
10.535
-3.711
-26.05%
jan 1, 1983
10.597
+0.062
0.59%
jan 1, 1984
10.96
+0.363
3.43%
jan 1, 1985
11.868
+0.907
8.28%
jan 1, 1986
8.961
-2.906
-24.49%
jan 1, 1987
8.023
-0.939
-10.47%
jan 1, 1988
7.408
-0.615
-7.66%
jan 1, 1989
8.372
+0.964
13.01%
jan 1, 1990
11.048
+2.676
31.97%
jan 1, 1991
9.291
-1.757
-15.9%
jan 1, 1992
8.671
-0.62
-6.67%
jan 1, 1993
6.191
-2.48
-28.61%
jan 1, 1994
11.436
+5.246
84.74%
jan 1, 1995
23.249
+11.813
103.29%
jan 1, 1996
10.213
-13.036
-56.07%
jan 1, 1997
8.369
-1.845
-18.06%
jan 1, 1998
4.965
-3.404
-40.68%
jan 1, 1999
6.931
+1.967
39.62%
jan 1, 2000
7.028
+0.096
1.39%
jan 1, 2001
7.233
+0.205
2.92%
jan 1, 2002
5.306
-1.928
-26.65%
jan 1, 2003
3.726
-1.58
-29.78%
jan 1, 2004
5.859
+2.133
57.25%
jan 1, 2005
7.688
+1.83
31.23%
jan 1, 2006
7.688
0.0
0.0%
jan 1, 2007
9.133
+1.445
18.8%
jan 1, 2008
6.102
-3.031
-33.19%
jan 1, 2009
10.316
+4.214
69.06%
jan 1, 2010
5.18
-5.136
-49.78%
jan 1, 2011
6.391
+1.211
23.37%
jan 1, 2012
8.58
+2.189
34.25%
jan 1, 2013
5.839
-2.741
-31.95%
jan 1, 2014
3.975
-1.865
-31.94%
jan 1, 2015
3.295
-0.68
-17.11%
jan 1, 2016
2.864
-0.431
-13.08%
Ranking of countries by current statistics by years


Comments: