29
/
en
AIzaSyAYiBZKx7MnpbEhh9jyipgxe19OcubqV5w
April 1, 2024
85215
Bermuda
BMU
true
2
1
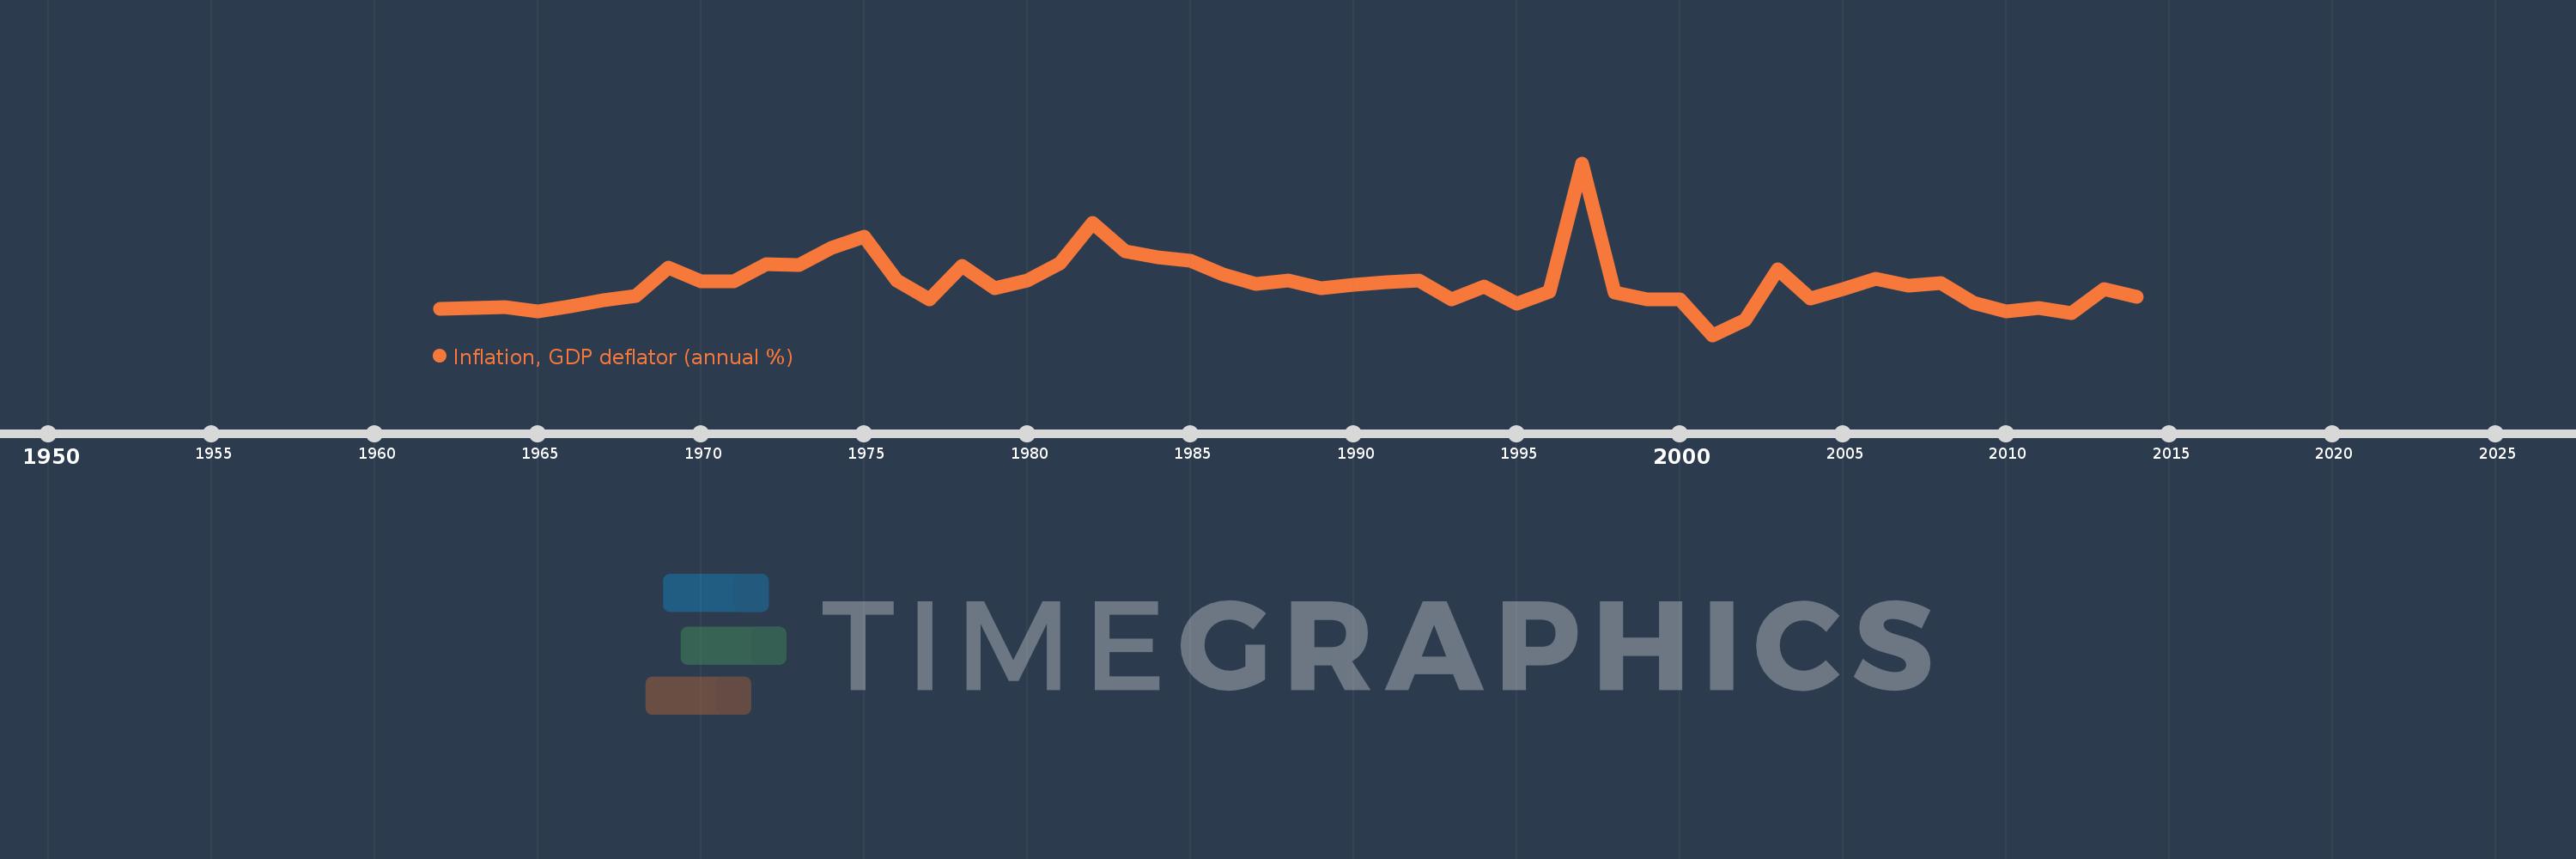
Inflation, GDP deflator (annual %)
2014,2013,2012,2011,2010,2009,2008,2007,2006,2005,2004,2003,2002,2001,2000,1999,1998,1997,1996,1995,1994,1993,1992,1991,1990,1989,1988,1987,1986,1985,1984,1983,1982,1981,1980,1979,1978,1977,1976,1975,1974,1973,1972,1971,1970,1969,1968,1967,1966,1965,1964,1963,1962
This statistics in other country:
AfghanistanAlbaniaAlgeriaAndorraAngolaAntigua and BarbudaArab WorldArgentinaArmeniaArubaAustraliaAustriaAzerbaijanBahamas, TheBahrainBangladeshBarbadosBelarusBelgiumBelizeBeninBermudaBhutanBoliviaBosnia and HerzegovinaBotswanaBrazilBrunei DarussalamBulgariaBurkina FasoBurundiCabo VerdeCambodiaCameroonCanadaCaribbean small statesCayman IslandsCentral African RepublicCentral Europe and the BalticsChadChannel IslandsChileChinaColombiaComorosCongo, Dem. Rep.Congo, Rep.Costa RicaCote d'IvoireCroatiaCubaCyprusCzech RepublicDenmarkDjiboutiDominicaDominican RepublicEarly-demographic dividendEast Asia & PacificEast Asia & Pacific (excluding high income)East Asia & Pacific (IDA & IBRD countries)EcuadorEgypt, Arab Rep.El SalvadorEquatorial GuineaEritreaEstoniaEthiopiaEuro areaEurope & Central AsiaEurope & Central Asia (excluding high income)Europe & Central Asia (IDA & IBRD countries)European UnionFijiFinlandFragile and conflict affected situationsFranceFrench PolynesiaGabonGambia, TheGeorgiaGermanyGhanaGreeceGreenlandGrenadaGuatemalaGuineaGuinea-BissauGuyanaHaitiHeavily indebted poor countries (HIPC)High incomeHondurasHong Kong SAR, ChinaHungaryIBRD onlyIcelandIDA & IBRD totalIDA blendIDA onlyIDA totalIndiaIndonesiaIran, Islamic Rep.IraqIrelandIsle of ManIsraelItalyJamaicaJapanJordanKazakhstanKenyaKiribatiKorea, Rep.KosovoKuwaitKyrgyz RepublicLao PDRLate-demographic dividendLatin America & Caribbean Latin America & Caribbean (excluding high income)Latin America & the Caribbean (IDA & IBRD countries)LatviaLeast developed countries: UN classificationLebanonLesothoLiberiaLibyaLiechtensteinLithuaniaLow & middle incomeLow incomeLower middle incomeLuxembourgMacao SAR, ChinaMacedonia, FYRMadagascarMalawiMalaysiaMaldivesMaliMaltaMarshall IslandsMauritaniaMauritiusMexicoMicronesia, Fed. Sts.Middle East & North AfricaMiddle East & North Africa (excluding high income)Middle East & North Africa (IDA & IBRD countries)Middle incomeMoldovaMonacoMongoliaMontenegroMoroccoMozambiqueMyanmarNamibiaNauruNepalNetherlandsNew CaledoniaNew ZealandNicaraguaNigerNigeriaNorth AmericaNorwayOECD membersOmanOther small statesPacific island small statesPakistanPalauPanamaPapua New GuineaParaguayPeruPhilippinesPolandPortugalPost-demographic dividendPre-demographic dividendPuerto RicoQatarRomaniaRussian FederationRwandaSamoaSan MarinoSao Tome and PrincipeSaudi ArabiaSenegalSerbiaSeychellesSierra LeoneSingaporeSlovak RepublicSloveniaSmall statesSolomon IslandsSomaliaSouth AfricaSouth AsiaSouth Asia (IDA & IBRD)South SudanSpainSri LankaSt. Kitts and NevisSt. LuciaSt. Vincent and the GrenadinesSub-Saharan Africa Sub-Saharan Africa (excluding high income)Sub-Saharan Africa (IDA & IBRD countries)SudanSurinameSwazilandSwedenSwitzerlandSyrian Arab RepublicTajikistanTanzaniaThailandTimor-LesteTogoTongaTrinidad and TobagoTunisiaTurkeyTurkmenistanTuvaluUgandaUkraineUnited Arab EmiratesUnited KingdomUnited StatesUpper middle incomeUruguayUzbekistanVanuatuVenezuela, RBVietnamVirgin Islands (U.S.)West Bank and GazaWorldYemen, Rep.ZambiaZimbabwe Timeline:
This timeline shows a graph from 1962 to 2014 of Bermuda. No data until 1961. Number of actual observations by date: 53.
Source name:
World Development Indicators
Source organization:
World Bank national accounts data, and OECD National Accounts data files.
Categories, topics:
Economy & Growth
Last updated:
apr 23, 2017
Indicators value changes by year
Minimum:
-4.236
jan 1, 2001
Maximum:
29.365
jan 1, 1997
At the date of observation
Value
Absolute change
Change from previous value
jan 1, 1962
0.939
+0.939
0.0%
jan 1, 1963
0.977
+0.038
3.99%
jan 1, 1964
1.271
+0.294
30.13%
jan 1, 1965
0.461
-0.81
-63.72%
jan 1, 1966
1.461
+1.0
216.91%
jan 1, 1967
2.609
+1.147
78.53%
jan 1, 1968
3.48
+0.872
33.42%
jan 1, 1969
8.982
+5.501
158.07%
jan 1, 1970
6.281
-2.701
-30.07%
jan 1, 1971
6.27
-0.012
-0.18%
jan 1, 1972
9.546
+3.277
52.26%
jan 1, 1973
9.526
-0.02
-0.21%
jan 1, 1974
12.812
+3.286
34.5%
jan 1, 1975
14.984
+2.172
16.95%
jan 1, 1976
6.357
-8.627
-57.57%
jan 1, 1977
2.784
-3.573
-56.21%
jan 1, 1978
9.269
+6.485
232.98%
jan 1, 1979
4.919
-4.35
-46.93%
jan 1, 1980
6.415
+1.497
30.43%
jan 1, 1981
9.854
+3.439
53.6%
jan 1, 1982
17.709
+7.855
79.72%
jan 1, 1983
12.209
-5.501
-31.06%
jan 1, 1984
10.997
-1.211
-9.92%
jan 1, 1985
10.297
-0.701
-6.37%
jan 1, 1986
7.614
-2.682
-26.05%
jan 1, 1987
5.835
-1.779
-23.36%
jan 1, 1988
6.488
+0.653
11.19%
jan 1, 1989
4.893
-1.595
-24.59%
jan 1, 1990
5.637
+0.744
15.2%
jan 1, 1991
6.034
+0.397
7.04%
jan 1, 1992
6.431
+0.397
6.58%
jan 1, 1993
2.814
-3.617
-56.24%
jan 1, 1994
5.196
+2.382
84.67%
jan 1, 1995
1.96
-3.237
-62.29%
jan 1, 1996
4.178
+2.219
113.23%
jan 1, 1997
29.365
+25.186
602.76%
jan 1, 1998
4.024
-25.341
-86.3%
jan 1, 1999
2.742
-1.282
-31.87%
jan 1, 2000
2.712
-0.029
-1.07%
jan 1, 2001
-4.236
-6.949
-256.2%
jan 1, 2002
-1.369
+2.867
-67.68%
jan 1, 2003
8.58
+9.95
-726.68%
jan 1, 2004
2.825
-5.756
-67.08%
jan 1, 2005
4.692
+1.867
66.11%
jan 1, 2006
6.762
+2.07
44.12%
jan 1, 2007
5.377
-1.385
-20.48%
jan 1, 2008
5.866
+0.489
9.1%
jan 1, 2009
2.085
-3.781
-64.45%
jan 1, 2010
0.334
-1.752
-84.0%
jan 1, 2011
1.049
+0.715
214.36%
jan 1, 2012
-0.033
-1.081
-103.11%
jan 1, 2013
4.83
+4.862
-14.93K%
jan 1, 2014
3.246
-1.584
-32.79%
Ranking of countries by current statistics by years


Comments: