29
/
en
AIzaSyAYiBZKx7MnpbEhh9jyipgxe19OcubqV5w
April 1, 2024
158552
Iraq
IRQ
true
2
1
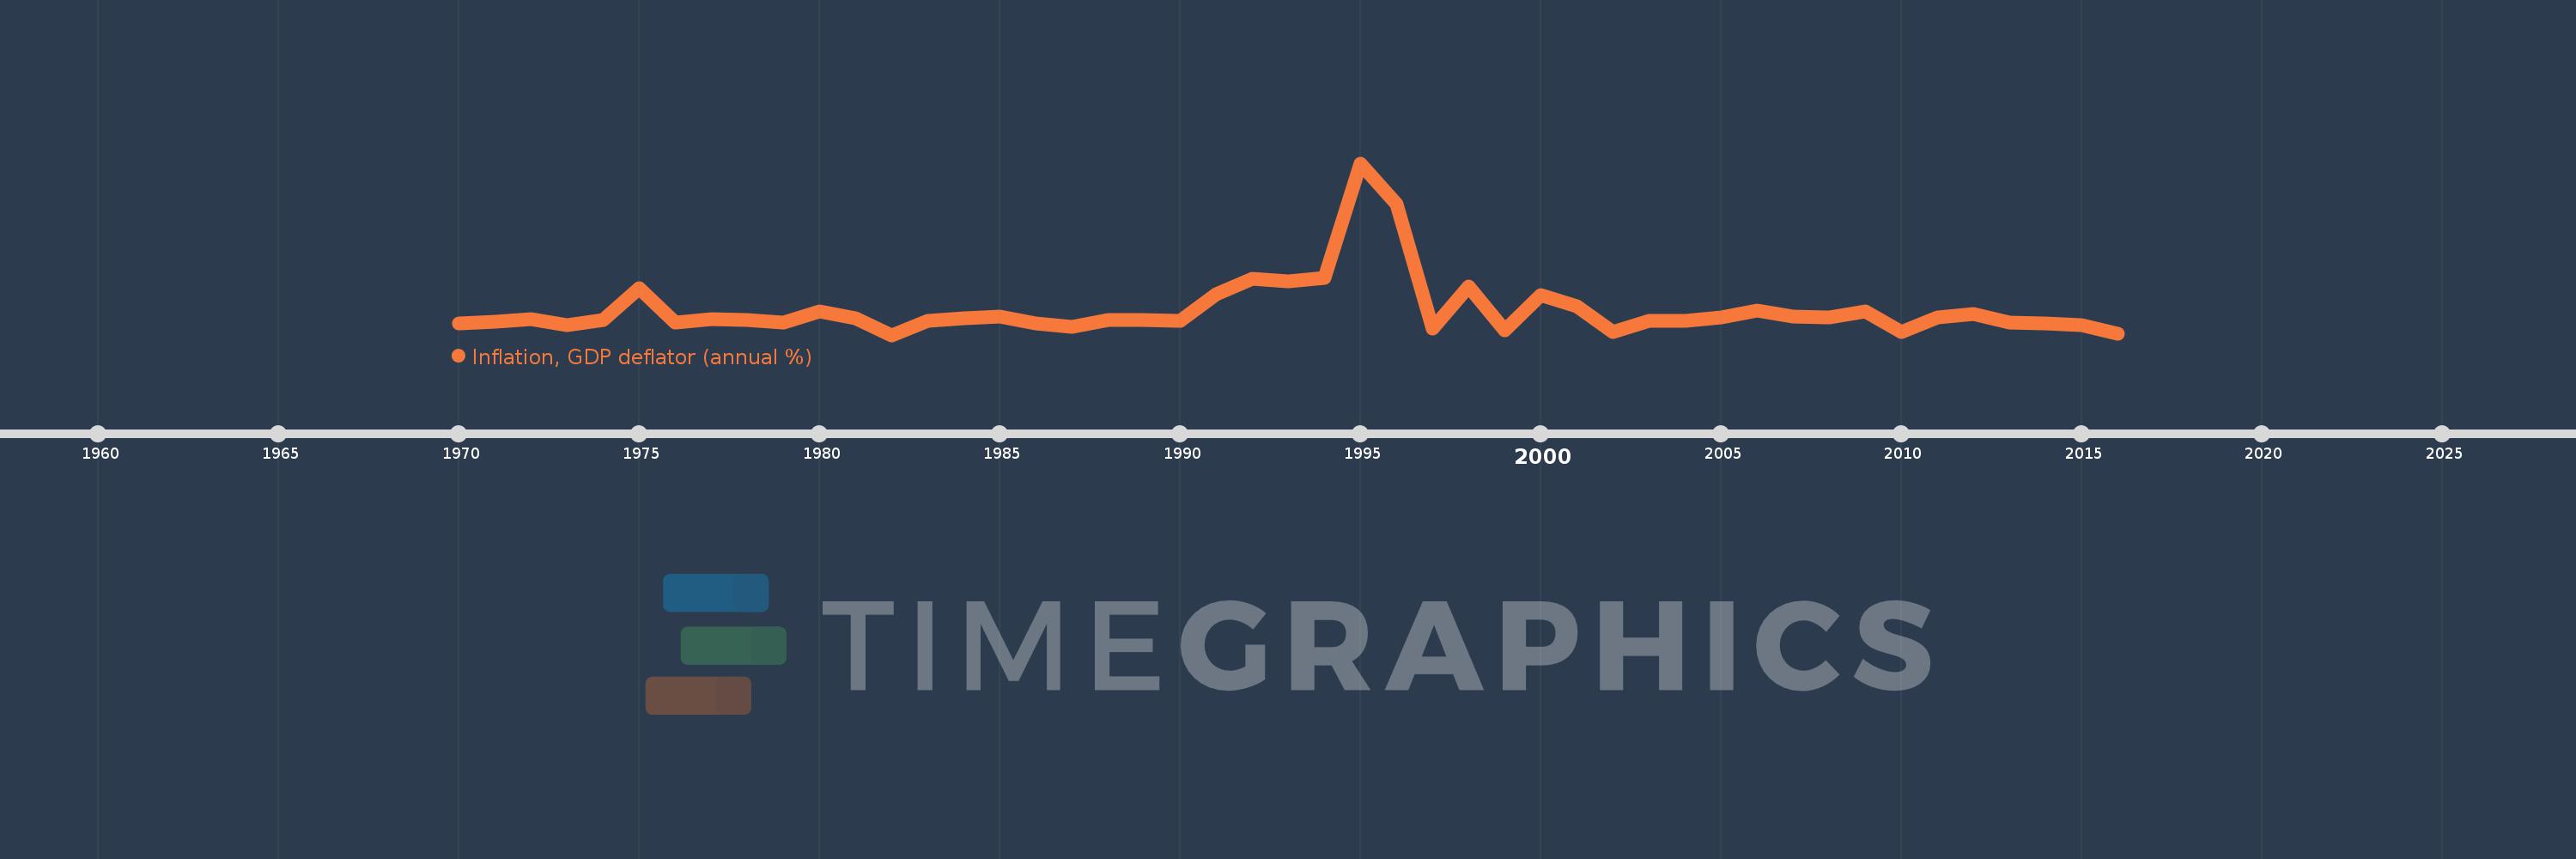
Inflation, GDP deflator (annual %)
2016,2015,2014,2013,2012,2011,2010,2009,2008,2007,2006,2005,2004,2003,2002,2001,2000,1999,1998,1997,1996,1995,1994,1993,1992,1991,1990,1989,1988,1987,1986,1985,1984,1983,1982,1981,1980,1979,1978,1977,1976,1975,1974,1973,1972,1971,1970
This statistics in other country:
AfghanistanAlbaniaAlgeriaAndorraAngolaAntigua and BarbudaArab WorldArgentinaArmeniaArubaAustraliaAustriaAzerbaijanBahamas, TheBahrainBangladeshBarbadosBelarusBelgiumBelizeBeninBermudaBhutanBoliviaBosnia and HerzegovinaBotswanaBrazilBrunei DarussalamBulgariaBurkina FasoBurundiCabo VerdeCambodiaCameroonCanadaCaribbean small statesCayman IslandsCentral African RepublicCentral Europe and the BalticsChadChannel IslandsChileChinaColombiaComorosCongo, Dem. Rep.Congo, Rep.Costa RicaCote d'IvoireCroatiaCubaCyprusCzech RepublicDenmarkDjiboutiDominicaDominican RepublicEarly-demographic dividendEast Asia & PacificEast Asia & Pacific (excluding high income)East Asia & Pacific (IDA & IBRD countries)EcuadorEgypt, Arab Rep.El SalvadorEquatorial GuineaEritreaEstoniaEthiopiaEuro areaEurope & Central AsiaEurope & Central Asia (excluding high income)Europe & Central Asia (IDA & IBRD countries)European UnionFijiFinlandFragile and conflict affected situationsFranceFrench PolynesiaGabonGambia, TheGeorgiaGermanyGhanaGreeceGreenlandGrenadaGuatemalaGuineaGuinea-BissauGuyanaHaitiHeavily indebted poor countries (HIPC)High incomeHondurasHong Kong SAR, ChinaHungaryIBRD onlyIcelandIDA & IBRD totalIDA blendIDA onlyIDA totalIndiaIndonesiaIran, Islamic Rep.IraqIrelandIsle of ManIsraelItalyJamaicaJapanJordanKazakhstanKenyaKiribatiKorea, Rep.KosovoKuwaitKyrgyz RepublicLao PDRLate-demographic dividendLatin America & Caribbean Latin America & Caribbean (excluding high income)Latin America & the Caribbean (IDA & IBRD countries)LatviaLeast developed countries: UN classificationLebanonLesothoLiberiaLibyaLiechtensteinLithuaniaLow & middle incomeLow incomeLower middle incomeLuxembourgMacao SAR, ChinaMacedonia, FYRMadagascarMalawiMalaysiaMaldivesMaliMaltaMarshall IslandsMauritaniaMauritiusMexicoMicronesia, Fed. Sts.Middle East & North AfricaMiddle East & North Africa (excluding high income)Middle East & North Africa (IDA & IBRD countries)Middle incomeMoldovaMonacoMongoliaMontenegroMoroccoMozambiqueMyanmarNamibiaNauruNepalNetherlandsNew CaledoniaNew ZealandNicaraguaNigerNigeriaNorth AmericaNorwayOECD membersOmanOther small statesPacific island small statesPakistanPalauPanamaPapua New GuineaParaguayPeruPhilippinesPolandPortugalPost-demographic dividendPre-demographic dividendPuerto RicoQatarRomaniaRussian FederationRwandaSamoaSan MarinoSao Tome and PrincipeSaudi ArabiaSenegalSerbiaSeychellesSierra LeoneSingaporeSlovak RepublicSloveniaSmall statesSolomon IslandsSomaliaSouth AfricaSouth AsiaSouth Asia (IDA & IBRD)South SudanSpainSri LankaSt. Kitts and NevisSt. LuciaSt. Vincent and the GrenadinesSub-Saharan Africa Sub-Saharan Africa (excluding high income)Sub-Saharan Africa (IDA & IBRD countries)SudanSurinameSwazilandSwedenSwitzerlandSyrian Arab RepublicTajikistanTanzaniaThailandTimor-LesteTogoTongaTrinidad and TobagoTunisiaTurkeyTurkmenistanTuvaluUgandaUkraineUnited Arab EmiratesUnited KingdomUnited StatesUpper middle incomeUruguayUzbekistanVanuatuVenezuela, RBVietnamVirgin Islands (U.S.)West Bank and GazaWorldYemen, Rep.ZambiaZimbabwe Timeline:
This timeline shows a graph from 1970 to 2016 of Iraq. No data until 1969. Number of actual observations by date: 47.
Source name:
World Development Indicators
Source organization:
World Bank national accounts data, and OECD National Accounts data files.
Categories, topics:
Economy & Growth
Last updated:
apr 23, 2017
Indicators value changes by year
Minimum:
-27.523
jan 1, 1982
Maximum:
396.438
jan 1, 1995
At the date of observation
Value
Absolute change
Change from previous value
jan 1, 1970
0.575
+0.575
0.0%
jan 1, 1971
4.353
+3.778
657.34%
jan 1, 1972
10.65
+6.297
144.66%
jan 1, 1973
-3.382
-14.032
-131.76%
jan 1, 1974
8.754
+12.136
-358.84%
jan 1, 1975
88.333
+79.578
909.04%
jan 1, 1976
3.884
-84.448
-95.6%
jan 1, 1977
12.586
+8.701
224.01%
jan 1, 1978
9.65
-2.935
-23.32%
jan 1, 1979
2.327
-7.323
-75.89%
jan 1, 1980
31.667
+29.34
1.26K%
jan 1, 1981
13.202
-18.465
-58.31%
jan 1, 1982
-27.523
-40.724
-308.48%
jan 1, 1983
8.334
+35.857
-130.28%
jan 1, 1984
14.192
+5.857
70.28%
jan 1, 1985
17.029
+2.838
20.0%
jan 1, 1986
1.689
-15.34
-90.08%
jan 1, 1987
-6.732
-8.421
-498.54%
jan 1, 1988
9.894
+16.626
-246.98%
jan 1, 1989
10.431
+0.537
5.43%
jan 1, 1990
8.402
-2.03
-19.46%
jan 1, 1991
73.645
+65.244
776.57%
jan 1, 1992
111.126
+37.481
50.89%
jan 1, 1993
104.501
-6.626
-5.96%
jan 1, 1994
114.468
+9.967
9.54%
jan 1, 1995
396.438
+281.97
246.33%
jan 1, 1996
295.368
-101.07
-25.49%
jan 1, 1997
-12.544
-307.912
-104.25%
jan 1, 1998
91.499
+104.043
-829.41%
jan 1, 1999
-15.861
-107.36
-117.33%
jan 1, 2000
71.148
+87.009
-548.58%
jan 1, 2001
43.678
-27.47
-38.61%
jan 1, 2002
-19.577
-63.255
-144.82%
jan 1, 2003
6.653
+26.23
-133.99%
jan 1, 2004
7.804
+1.151
17.3%
jan 1, 2005
16.722
+8.917
114.26%
jan 1, 2006
32.307
+15.585
93.2%
jan 1, 2007
18.005
-14.302
-44.27%
jan 1, 2008
15.016
-2.989
-16.6%
jan 1, 2009
30.175
+15.16
100.96%
jan 1, 2010
-19.521
-49.697
-164.69%
jan 1, 2011
16.587
+36.108
-184.97%
jan 1, 2012
24.689
+8.103
48.85%
jan 1, 2013
2.67
-22.02
-89.19%
jan 1, 2014
0.984
-1.686
-63.14%
jan 1, 2015
-2.58
-3.565
-362.2%
jan 1, 2016
-23.495
-20.915
810.5%
Ranking of countries by current statistics by years


Comments: