29
/
en
AIzaSyAYiBZKx7MnpbEhh9jyipgxe19OcubqV5w
April 1, 2024
233090
San Marino
SMR
true
2
1
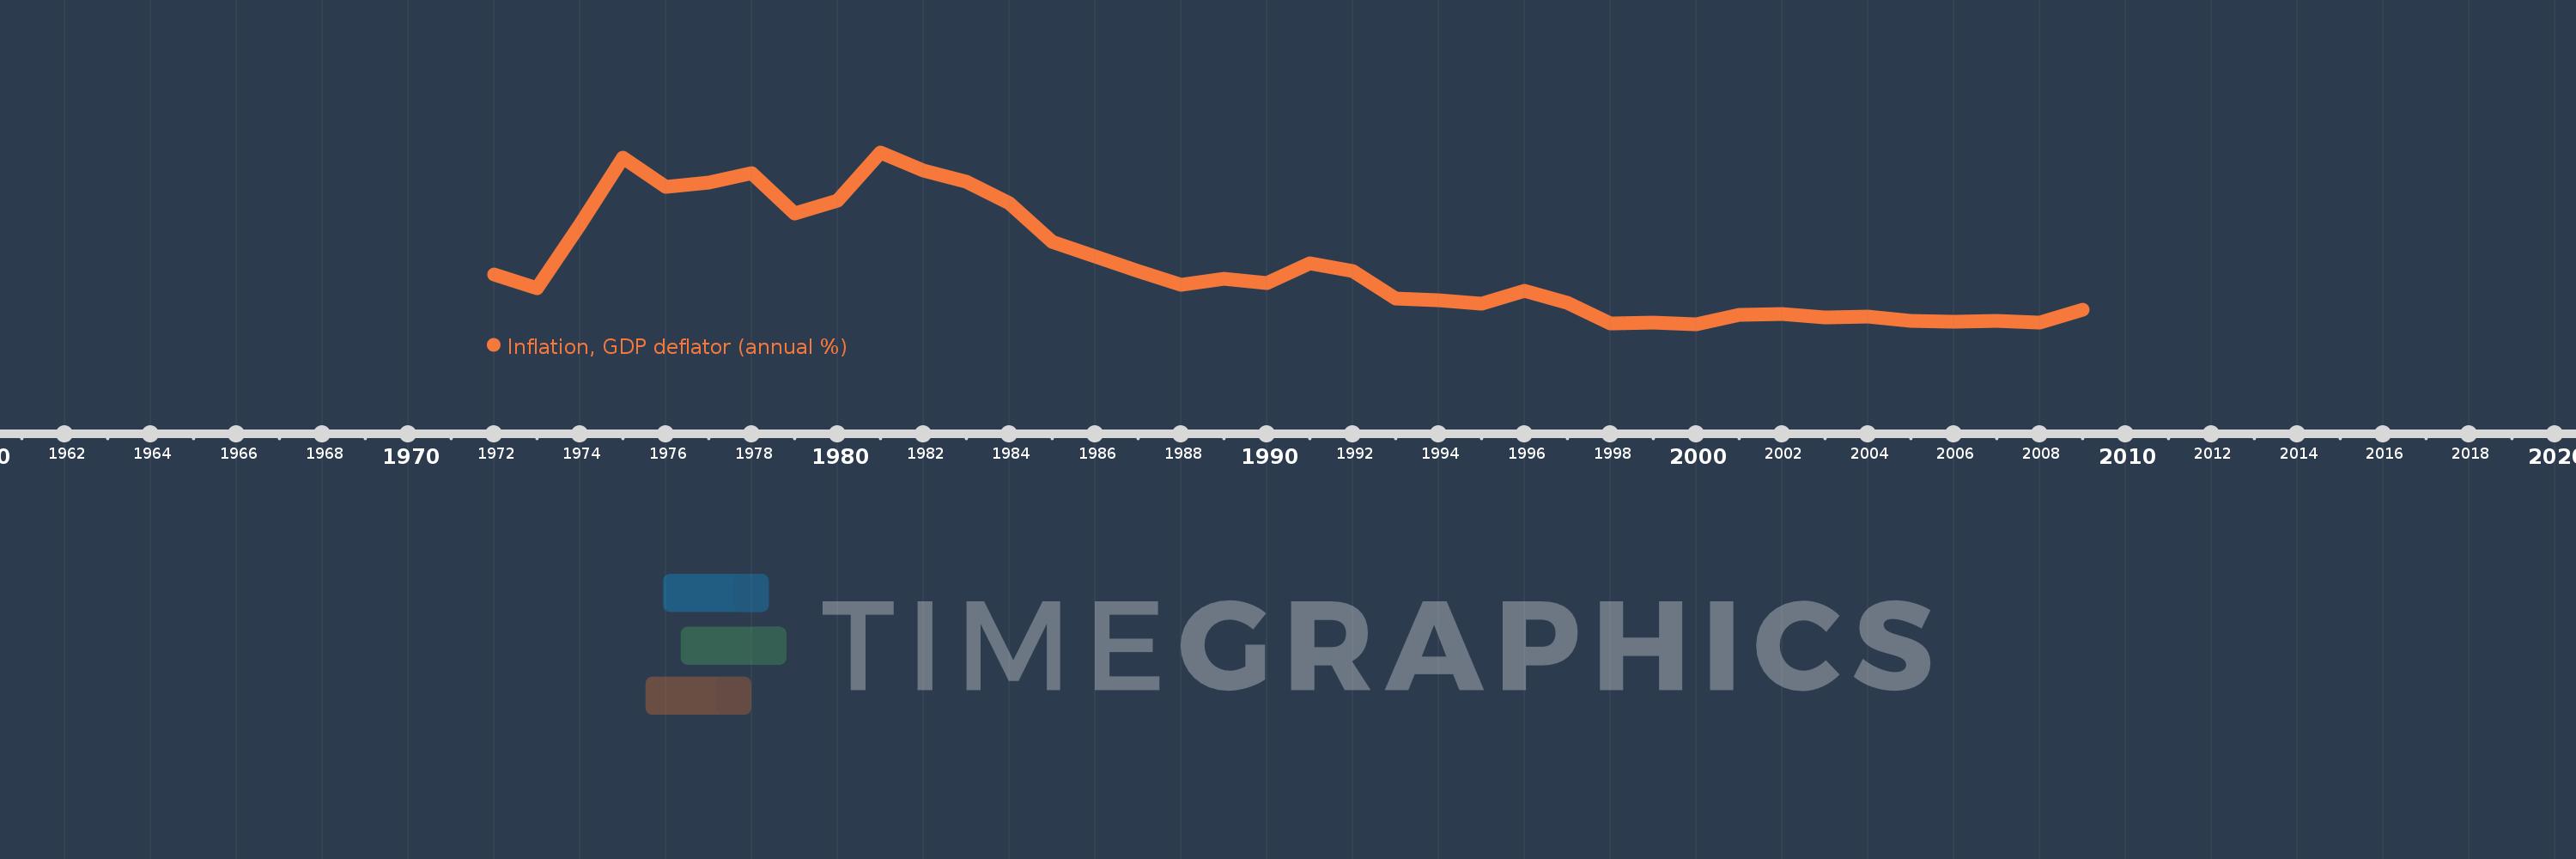
Inflation, GDP deflator (annual %)
2009,2008,2007,2006,2005,2004,2003,2002,2001,2000,1999,1998,1997,1996,1995,1994,1993,1992,1991,1990,1989,1988,1987,1986,1985,1984,1983,1982,1981,1980,1979,1978,1977,1976,1975,1974,1973,1972
This statistics in other country:
AfghanistanAlbaniaAlgeriaAndorraAngolaAntigua and BarbudaArab WorldArgentinaArmeniaArubaAustraliaAustriaAzerbaijanBahamas, TheBahrainBangladeshBarbadosBelarusBelgiumBelizeBeninBermudaBhutanBoliviaBosnia and HerzegovinaBotswanaBrazilBrunei DarussalamBulgariaBurkina FasoBurundiCabo VerdeCambodiaCameroonCanadaCaribbean small statesCayman IslandsCentral African RepublicCentral Europe and the BalticsChadChannel IslandsChileChinaColombiaComorosCongo, Dem. Rep.Congo, Rep.Costa RicaCote d'IvoireCroatiaCubaCyprusCzech RepublicDenmarkDjiboutiDominicaDominican RepublicEarly-demographic dividendEast Asia & PacificEast Asia & Pacific (excluding high income)East Asia & Pacific (IDA & IBRD countries)EcuadorEgypt, Arab Rep.El SalvadorEquatorial GuineaEritreaEstoniaEthiopiaEuro areaEurope & Central AsiaEurope & Central Asia (excluding high income)Europe & Central Asia (IDA & IBRD countries)European UnionFijiFinlandFragile and conflict affected situationsFranceFrench PolynesiaGabonGambia, TheGeorgiaGermanyGhanaGreeceGreenlandGrenadaGuatemalaGuineaGuinea-BissauGuyanaHaitiHeavily indebted poor countries (HIPC)High incomeHondurasHong Kong SAR, ChinaHungaryIBRD onlyIcelandIDA & IBRD totalIDA blendIDA onlyIDA totalIndiaIndonesiaIran, Islamic Rep.IraqIrelandIsle of ManIsraelItalyJamaicaJapanJordanKazakhstanKenyaKiribatiKorea, Rep.KosovoKuwaitKyrgyz RepublicLao PDRLate-demographic dividendLatin America & Caribbean Latin America & Caribbean (excluding high income)Latin America & the Caribbean (IDA & IBRD countries)LatviaLeast developed countries: UN classificationLebanonLesothoLiberiaLibyaLiechtensteinLithuaniaLow & middle incomeLow incomeLower middle incomeLuxembourgMacao SAR, ChinaMacedonia, FYRMadagascarMalawiMalaysiaMaldivesMaliMaltaMarshall IslandsMauritaniaMauritiusMexicoMicronesia, Fed. Sts.Middle East & North AfricaMiddle East & North Africa (excluding high income)Middle East & North Africa (IDA & IBRD countries)Middle incomeMoldovaMonacoMongoliaMontenegroMoroccoMozambiqueMyanmarNamibiaNauruNepalNetherlandsNew CaledoniaNew ZealandNicaraguaNigerNigeriaNorth AmericaNorwayOECD membersOmanOther small statesPacific island small statesPakistanPalauPanamaPapua New GuineaParaguayPeruPhilippinesPolandPortugalPost-demographic dividendPre-demographic dividendPuerto RicoQatarRomaniaRussian FederationRwandaSamoaSan MarinoSao Tome and PrincipeSaudi ArabiaSenegalSerbiaSeychellesSierra LeoneSingaporeSlovak RepublicSloveniaSmall statesSolomon IslandsSomaliaSouth AfricaSouth AsiaSouth Asia (IDA & IBRD)South SudanSpainSri LankaSt. Kitts and NevisSt. LuciaSt. Vincent and the GrenadinesSub-Saharan Africa Sub-Saharan Africa (excluding high income)Sub-Saharan Africa (IDA & IBRD countries)SudanSurinameSwazilandSwedenSwitzerlandSyrian Arab RepublicTajikistanTanzaniaThailandTimor-LesteTogoTongaTrinidad and TobagoTunisiaTurkeyTurkmenistanTuvaluUgandaUkraineUnited Arab EmiratesUnited KingdomUnited StatesUpper middle incomeUruguayUzbekistanVanuatuVenezuela, RBVietnamVirgin Islands (U.S.)West Bank and GazaWorldYemen, Rep.ZambiaZimbabwe Timeline:
This timeline shows a graph from 1972 to 2009 of San Marino. No data until 1971. Number of actual observations by date: 38.
Source name:
World Development Indicators
Source organization:
World Bank national accounts data, and OECD National Accounts data files.
Categories, topics:
Economy & Growth
Last updated:
apr 23, 2017
Indicators value changes by year
Maximum:
20.816
jan 1, 1981
At the date of observation
Value
Absolute change
Change from previous value
jan 1, 1972
7.179
+7.179
0.0%
jan 1, 1973
5.633
-1.546
-21.54%
jan 1, 1974
12.739
+7.106
126.16%
jan 1, 1975
20.246
+7.508
58.94%
jan 1, 1976
16.983
-3.263
-16.12%
jan 1, 1977
17.454
+0.471
2.77%
jan 1, 1978
18.477
+1.023
5.86%
jan 1, 1979
13.946
-4.531
-24.52%
jan 1, 1980
15.451
+1.505
10.8%
jan 1, 1981
20.816
+5.365
34.72%
jan 1, 1982
18.787
-2.029
-9.75%
jan 1, 1983
17.541
-1.246
-6.63%
jan 1, 1984
15.097
-2.444
-13.93%
jan 1, 1985
10.762
-4.335
-28.71%
jan 1, 1986
9.175
-1.587
-14.75%
jan 1, 1987
7.488
-1.686
-18.38%
jan 1, 1988
6.009
-1.479
-19.75%
jan 1, 1989
6.65
+0.641
10.67%
jan 1, 1990
6.197
-0.453
-6.81%
jan 1, 1991
8.394
+2.197
35.45%
jan 1, 1992
7.541
-0.853
-10.16%
jan 1, 1993
4.4
-3.142
-41.66%
jan 1, 1994
4.26
-0.139
-3.17%
jan 1, 1995
3.871
-0.389
-9.13%
jan 1, 1996
5.33
+1.459
37.69%
jan 1, 1997
3.998
-1.332
-24.99%
jan 1, 1998
1.694
-2.304
-57.62%
jan 1, 1999
1.73
+0.035
2.09%
jan 1, 2000
1.569
-0.161
-9.31%
jan 1, 2001
2.629
+1.06
67.58%
jan 1, 2002
2.694
+0.065
2.48%
jan 1, 2003
2.376
-0.318
-11.81%
jan 1, 2004
2.414
+0.038
1.6%
jan 1, 2005
1.932
-0.481
-19.94%
jan 1, 2006
1.878
-0.055
-2.84%
jan 1, 2007
1.947
+0.07
3.71%
jan 1, 2008
1.74
-0.207
-10.62%
jan 1, 2009
3.231
+1.49
85.62%
Ranking of countries by current statistics by years


Comments: