29
/
en
AIzaSyAYiBZKx7MnpbEhh9jyipgxe19OcubqV5w
April 1, 2024
279938
Vanuatu
VUT
true
2
1
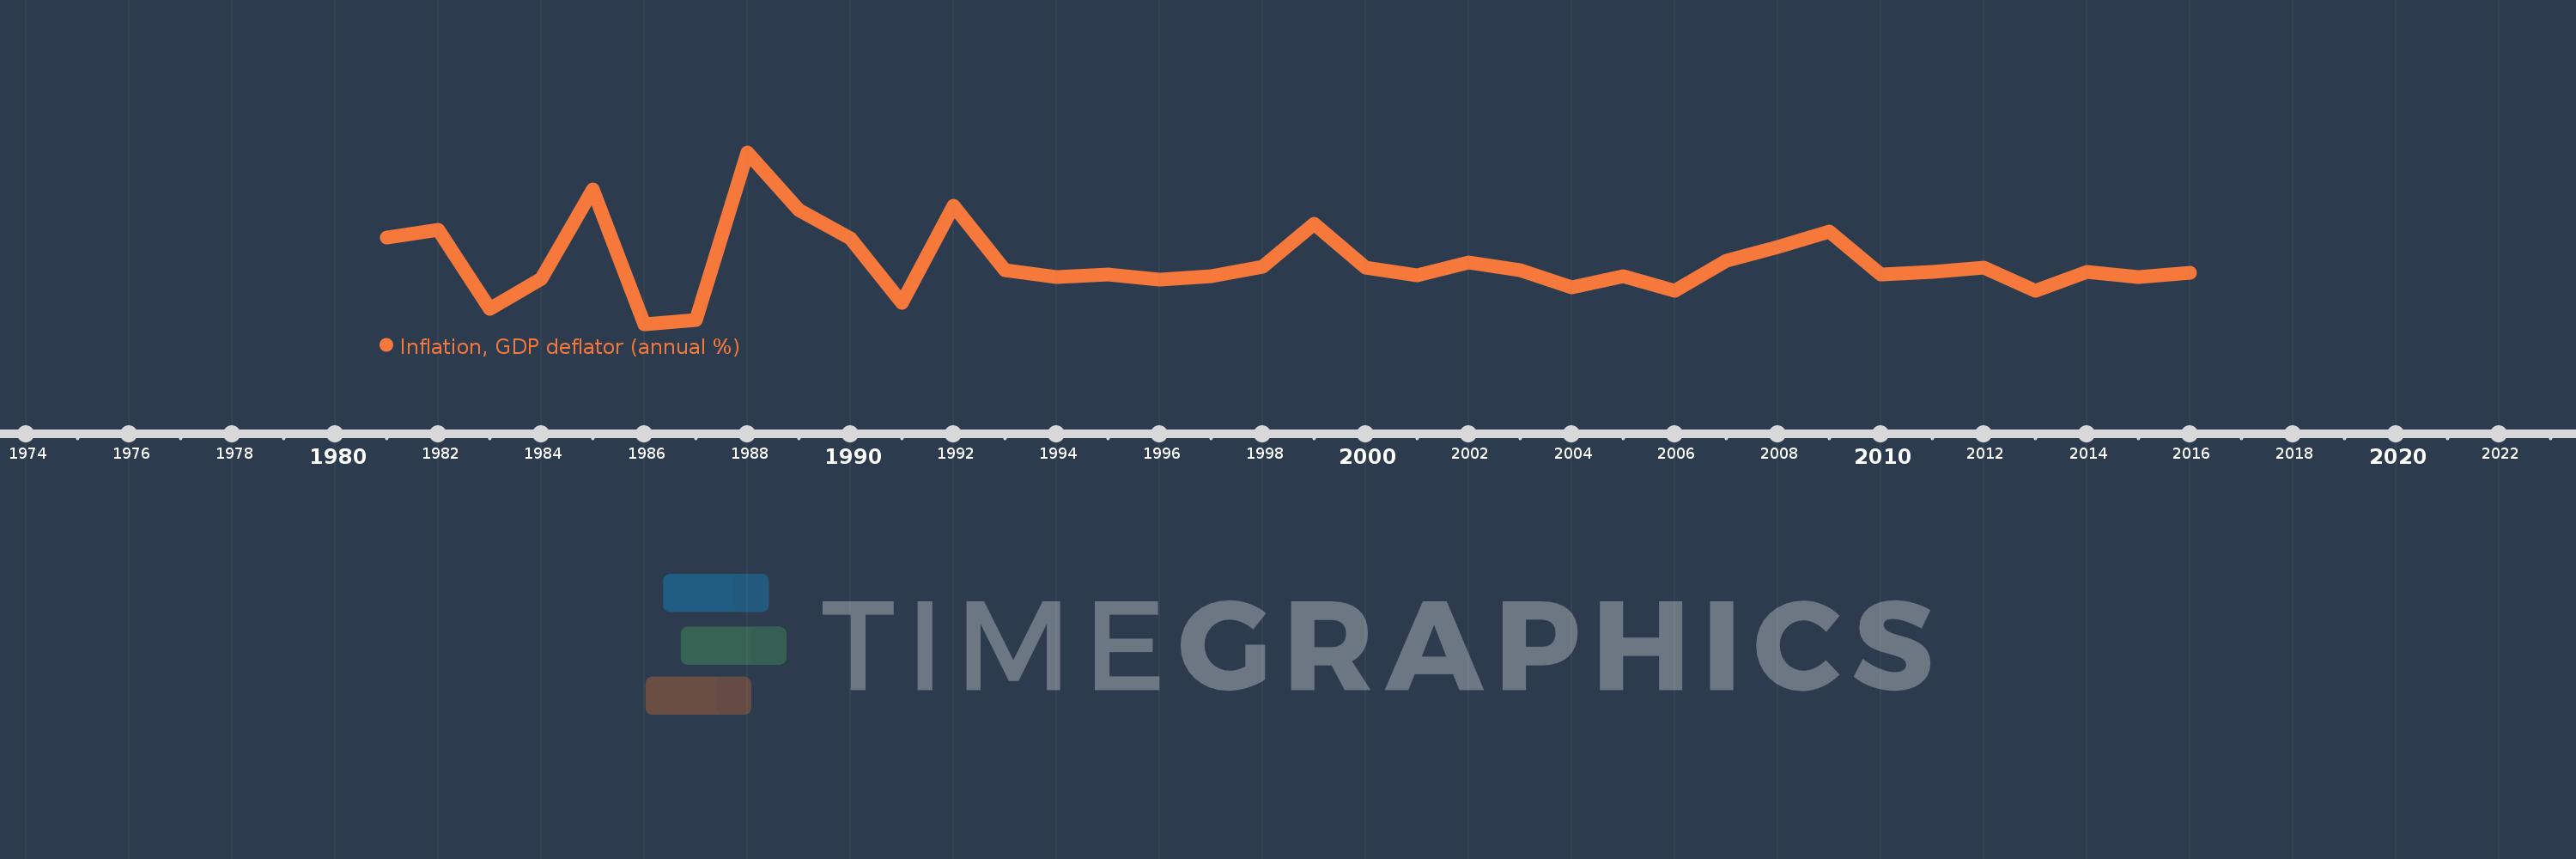
Inflation, GDP deflator (annual %)
2016,2015,2014,2013,2012,2011,2010,2009,2008,2007,2006,2005,2004,2003,2002,2001,2000,1999,1998,1997,1996,1995,1994,1993,1992,1991,1990,1989,1988,1987,1986,1985,1984,1983,1982,1981
This statistics in other country:
AfghanistanAlbaniaAlgeriaAndorraAngolaAntigua and BarbudaArab WorldArgentinaArmeniaArubaAustraliaAustriaAzerbaijanBahamas, TheBahrainBangladeshBarbadosBelarusBelgiumBelizeBeninBermudaBhutanBoliviaBosnia and HerzegovinaBotswanaBrazilBrunei DarussalamBulgariaBurkina FasoBurundiCabo VerdeCambodiaCameroonCanadaCaribbean small statesCayman IslandsCentral African RepublicCentral Europe and the BalticsChadChannel IslandsChileChinaColombiaComorosCongo, Dem. Rep.Congo, Rep.Costa RicaCote d'IvoireCroatiaCubaCyprusCzech RepublicDenmarkDjiboutiDominicaDominican RepublicEarly-demographic dividendEast Asia & PacificEast Asia & Pacific (excluding high income)East Asia & Pacific (IDA & IBRD countries)EcuadorEgypt, Arab Rep.El SalvadorEquatorial GuineaEritreaEstoniaEthiopiaEuro areaEurope & Central AsiaEurope & Central Asia (excluding high income)Europe & Central Asia (IDA & IBRD countries)European UnionFijiFinlandFragile and conflict affected situationsFranceFrench PolynesiaGabonGambia, TheGeorgiaGermanyGhanaGreeceGreenlandGrenadaGuatemalaGuineaGuinea-BissauGuyanaHaitiHeavily indebted poor countries (HIPC)High incomeHondurasHong Kong SAR, ChinaHungaryIBRD onlyIcelandIDA & IBRD totalIDA blendIDA onlyIDA totalIndiaIndonesiaIran, Islamic Rep.IraqIrelandIsle of ManIsraelItalyJamaicaJapanJordanKazakhstanKenyaKiribatiKorea, Rep.KosovoKuwaitKyrgyz RepublicLao PDRLate-demographic dividendLatin America & Caribbean Latin America & Caribbean (excluding high income)Latin America & the Caribbean (IDA & IBRD countries)LatviaLeast developed countries: UN classificationLebanonLesothoLiberiaLibyaLiechtensteinLithuaniaLow & middle incomeLow incomeLower middle incomeLuxembourgMacao SAR, ChinaMacedonia, FYRMadagascarMalawiMalaysiaMaldivesMaliMaltaMarshall IslandsMauritaniaMauritiusMexicoMicronesia, Fed. Sts.Middle East & North AfricaMiddle East & North Africa (excluding high income)Middle East & North Africa (IDA & IBRD countries)Middle incomeMoldovaMonacoMongoliaMontenegroMoroccoMozambiqueMyanmarNamibiaNauruNepalNetherlandsNew CaledoniaNew ZealandNicaraguaNigerNigeriaNorth AmericaNorwayOECD membersOmanOther small statesPacific island small statesPakistanPalauPanamaPapua New GuineaParaguayPeruPhilippinesPolandPortugalPost-demographic dividendPre-demographic dividendPuerto RicoQatarRomaniaRussian FederationRwandaSamoaSan MarinoSao Tome and PrincipeSaudi ArabiaSenegalSerbiaSeychellesSierra LeoneSingaporeSlovak RepublicSloveniaSmall statesSolomon IslandsSomaliaSouth AfricaSouth AsiaSouth Asia (IDA & IBRD)South SudanSpainSri LankaSt. Kitts and NevisSt. LuciaSt. Vincent and the GrenadinesSub-Saharan Africa Sub-Saharan Africa (excluding high income)Sub-Saharan Africa (IDA & IBRD countries)SudanSurinameSwazilandSwedenSwitzerlandSyrian Arab RepublicTajikistanTanzaniaThailandTimor-LesteTogoTongaTrinidad and TobagoTunisiaTurkeyTurkmenistanTuvaluUgandaUkraineUnited Arab EmiratesUnited KingdomUnited StatesUpper middle incomeUruguayUzbekistanVanuatuVenezuela, RBVietnamVirgin Islands (U.S.)West Bank and GazaWorldYemen, Rep.ZambiaZimbabwe Timeline:
This timeline shows a graph from 1981 to 2016 of Vanuatu. No data until 1980. Number of actual observations by date: 36.
Source name:
World Development Indicators
Source organization:
World Bank national accounts data, and OECD National Accounts data files.
Categories, topics:
Economy & Growth
Last updated:
apr 23, 2017
Indicators value changes by year
Minimum:
-3.441
jan 1, 1986
Maximum:
16.455
jan 1, 1988
At the date of observation
Value
Absolute change
Change from previous value
jan 1, 1981
6.616
+6.616
0.0%
jan 1, 1982
7.45
+0.834
12.6%
jan 1, 1983
-1.648
-9.098
-122.11%
jan 1, 1984
1.81
+3.457
-209.86%
jan 1, 1985
12.166
+10.357
572.21%
jan 1, 1986
-3.441
-15.607
-128.28%
jan 1, 1987
-2.975
+0.466
-13.54%
jan 1, 1988
16.455
+19.43
-653.14%
jan 1, 1989
9.812
-6.644
-40.38%
jan 1, 1990
6.452
-3.36
-34.24%
jan 1, 1991
-0.997
-7.449
-115.45%
jan 1, 1992
10.295
+11.292
-1.13K%
jan 1, 1993
2.779
-7.517
-73.01%
jan 1, 1994
2.049
-0.73
-26.27%
jan 1, 1995
2.346
+0.298
14.53%
jan 1, 1996
1.714
-0.633
-26.96%
jan 1, 1997
2.077
+0.364
21.23%
jan 1, 1998
3.178
+1.101
52.98%
jan 1, 1999
8.157
+4.979
156.69%
jan 1, 2000
3.075
-5.082
-62.3%
jan 1, 2001
2.185
-0.891
-28.96%
jan 1, 2002
3.723
+1.538
70.4%
jan 1, 2003
2.783
-0.94
-25.24%
jan 1, 2004
0.788
-1.994
-71.67%
jan 1, 2005
2.122
+1.334
169.16%
jan 1, 2006
0.422
-1.7
-80.12%
jan 1, 2007
3.873
+3.451
817.92%
jan 1, 2008
5.473
+1.6
41.31%
jan 1, 2009
7.323
+1.85
33.81%
jan 1, 2010
2.311
-5.012
-68.44%
jan 1, 2011
2.617
+0.306
13.24%
jan 1, 2012
3.099
+0.482
18.4%
jan 1, 2013
0.414
-2.685
-86.65%
jan 1, 2014
2.657
+2.243
542.26%
jan 1, 2015
1.984
-0.673
-25.33%
jan 1, 2016
2.485
+0.5
25.22%
Ranking of countries by current statistics by years


Comments: