29
/
en
AIzaSyAYiBZKx7MnpbEhh9jyipgxe19OcubqV5w
April 1, 2024
47239
Lower middle income
LMC
false
2
1
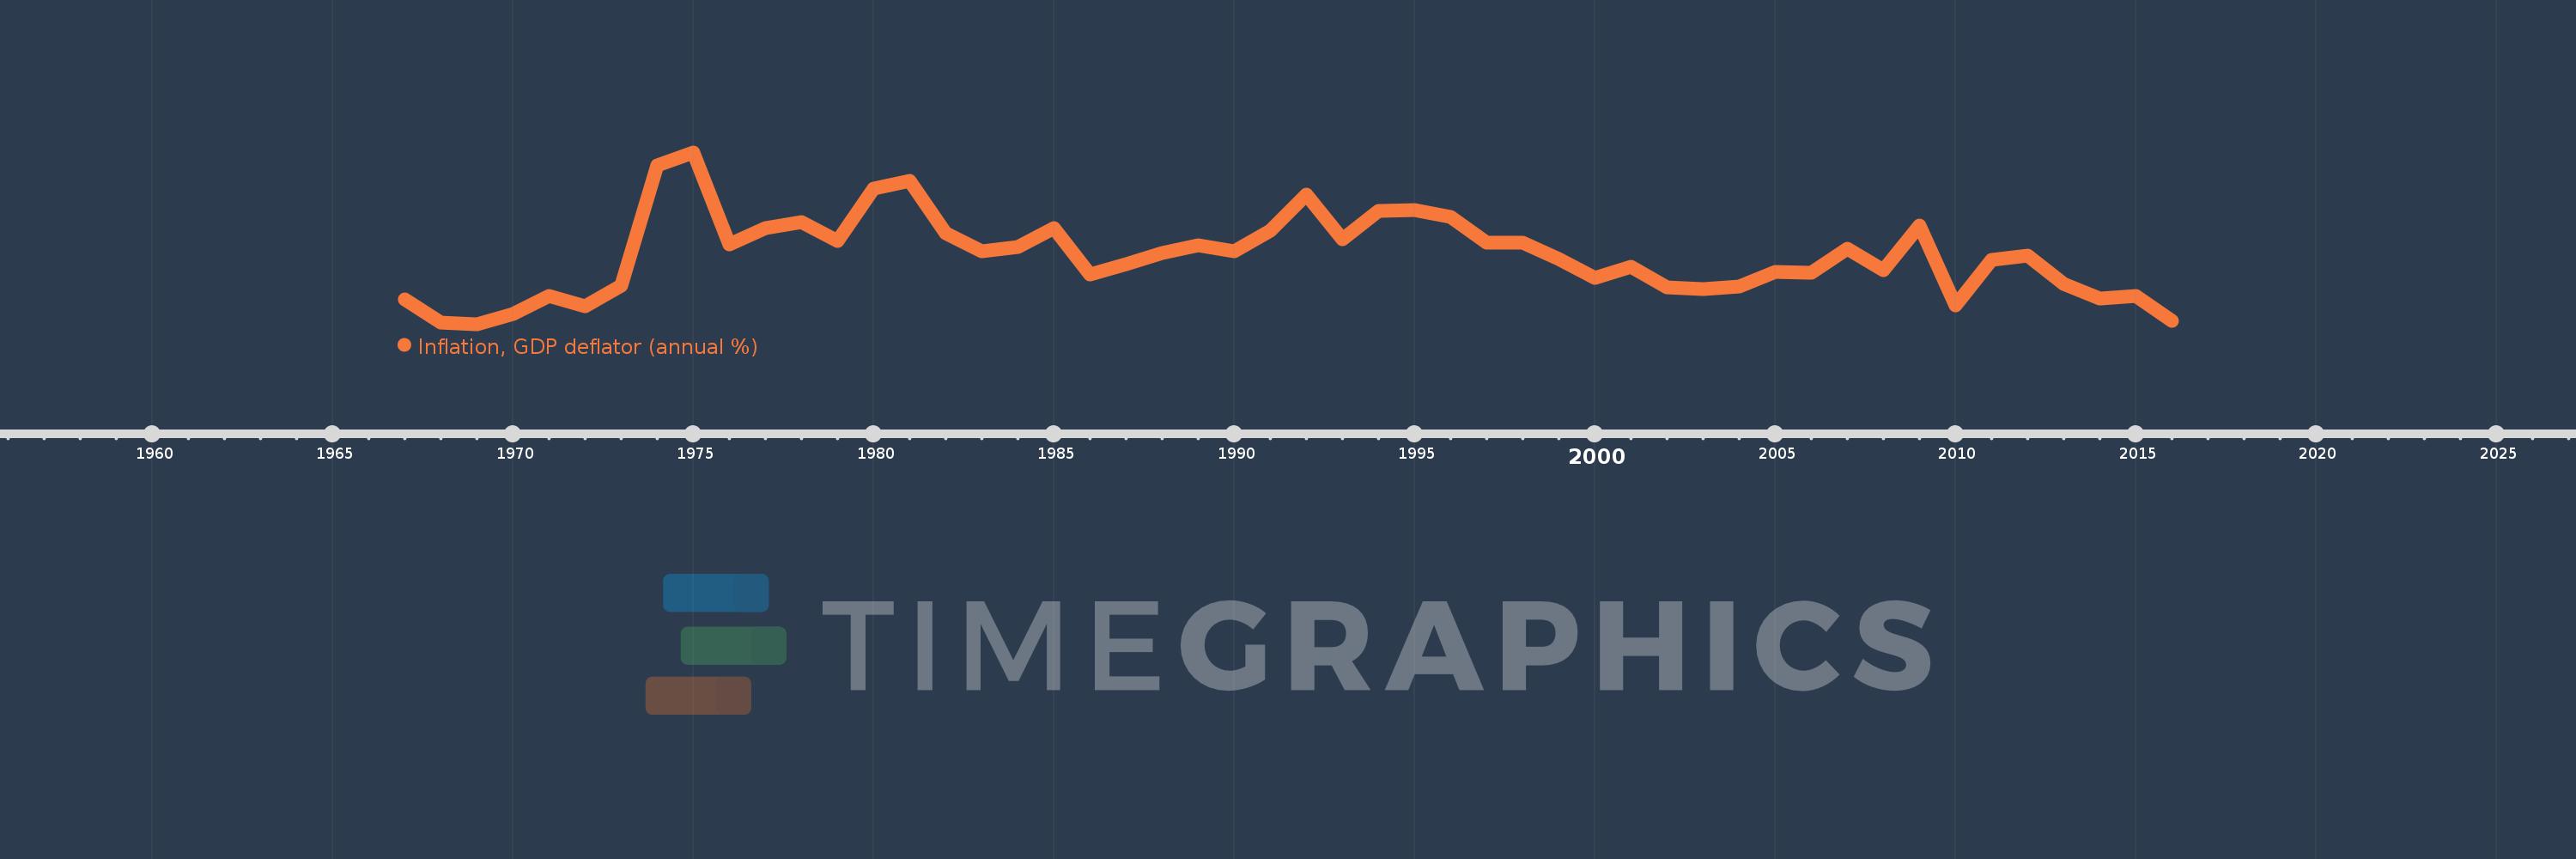
Inflation, GDP deflator (annual %)
2016,2015,2014,2013,2012,2011,2010,2009,2008,2007,2006,2005,2004,2003,2002,2001,2000,1999,1998,1997,1996,1995,1994,1993,1992,1991,1990,1989,1988,1987,1986,1985,1984,1983,1982,1981,1980,1979,1978,1977,1976,1975,1974,1973,1972,1971,1970,1969,1968,1967
This statistics in other country:
AfghanistanAlbaniaAlgeriaAndorraAngolaAntigua and BarbudaArab WorldArgentinaArmeniaArubaAustraliaAustriaAzerbaijanBahamas, TheBahrainBangladeshBarbadosBelarusBelgiumBelizeBeninBermudaBhutanBoliviaBosnia and HerzegovinaBotswanaBrazilBrunei DarussalamBulgariaBurkina FasoBurundiCabo VerdeCambodiaCameroonCanadaCaribbean small statesCayman IslandsCentral African RepublicCentral Europe and the BalticsChadChannel IslandsChileChinaColombiaComorosCongo, Dem. Rep.Congo, Rep.Costa RicaCote d'IvoireCroatiaCubaCyprusCzech RepublicDenmarkDjiboutiDominicaDominican RepublicEarly-demographic dividendEast Asia & PacificEast Asia & Pacific (excluding high income)East Asia & Pacific (IDA & IBRD countries)EcuadorEgypt, Arab Rep.El SalvadorEquatorial GuineaEritreaEstoniaEthiopiaEuro areaEurope & Central AsiaEurope & Central Asia (excluding high income)Europe & Central Asia (IDA & IBRD countries)European UnionFijiFinlandFragile and conflict affected situationsFranceFrench PolynesiaGabonGambia, TheGeorgiaGermanyGhanaGreeceGreenlandGrenadaGuatemalaGuineaGuinea-BissauGuyanaHaitiHeavily indebted poor countries (HIPC)High incomeHondurasHong Kong SAR, ChinaHungaryIBRD onlyIcelandIDA & IBRD totalIDA blendIDA onlyIDA totalIndiaIndonesiaIran, Islamic Rep.IraqIrelandIsle of ManIsraelItalyJamaicaJapanJordanKazakhstanKenyaKiribatiKorea, Rep.KosovoKuwaitKyrgyz RepublicLao PDRLate-demographic dividendLatin America & Caribbean Latin America & Caribbean (excluding high income)Latin America & the Caribbean (IDA & IBRD countries)LatviaLeast developed countries: UN classificationLebanonLesothoLiberiaLibyaLiechtensteinLithuaniaLow & middle incomeLow incomeLower middle incomeLuxembourgMacao SAR, ChinaMacedonia, FYRMadagascarMalawiMalaysiaMaldivesMaliMaltaMarshall IslandsMauritaniaMauritiusMexicoMicronesia, Fed. Sts.Middle East & North AfricaMiddle East & North Africa (excluding high income)Middle East & North Africa (IDA & IBRD countries)Middle incomeMoldovaMonacoMongoliaMontenegroMoroccoMozambiqueMyanmarNamibiaNauruNepalNetherlandsNew CaledoniaNew ZealandNicaraguaNigerNigeriaNorth AmericaNorwayOECD membersOmanOther small statesPacific island small statesPakistanPalauPanamaPapua New GuineaParaguayPeruPhilippinesPolandPortugalPost-demographic dividendPre-demographic dividendPuerto RicoQatarRomaniaRussian FederationRwandaSamoaSan MarinoSao Tome and PrincipeSaudi ArabiaSenegalSerbiaSeychellesSierra LeoneSingaporeSlovak RepublicSloveniaSmall statesSolomon IslandsSomaliaSouth AfricaSouth AsiaSouth Asia (IDA & IBRD)South SudanSpainSri LankaSt. Kitts and NevisSt. LuciaSt. Vincent and the GrenadinesSub-Saharan Africa Sub-Saharan Africa (excluding high income)Sub-Saharan Africa (IDA & IBRD countries)SudanSurinameSwazilandSwedenSwitzerlandSyrian Arab RepublicTajikistanTanzaniaThailandTimor-LesteTogoTongaTrinidad and TobagoTunisiaTurkeyTurkmenistanTuvaluUgandaUkraineUnited Arab EmiratesUnited KingdomUnited StatesUpper middle incomeUruguayUzbekistanVanuatuVenezuela, RBVietnamVirgin Islands (U.S.)West Bank and GazaWorldYemen, Rep.ZambiaZimbabwe Timeline:
This timeline shows a graph from 1967 to 2016 of Lower middle income. No data until 1966. Number of actual observations by date: 50.
Source name:
World Development Indicators
Source organization:
World Bank national accounts data, and OECD National Accounts data files.
Categories, topics:
Economy & Growth
Last updated:
apr 23, 2017
Indicators value changes by year
Maximum:
16.668
jan 1, 1975
At the date of observation
Value
Absolute change
Change from previous value
jan 1, 1967
4.009
+4.009
0.0%
jan 1, 1968
2.008
-2.001
-49.91%
jan 1, 1969
1.899
-0.109
-5.44%
jan 1, 1970
2.762
+0.864
45.49%
jan 1, 1971
4.307
+1.545
55.92%
jan 1, 1972
3.414
-0.893
-20.74%
jan 1, 1973
5.228
+1.814
53.15%
jan 1, 1974
15.544
+10.316
197.33%
jan 1, 1975
16.668
+1.124
7.23%
jan 1, 1976
8.756
-7.911
-47.46%
jan 1, 1977
10.129
+1.372
15.67%
jan 1, 1978
10.663
+0.535
5.28%
jan 1, 1979
9.035
-1.628
-15.27%
jan 1, 1980
13.588
+4.553
50.39%
jan 1, 1981
14.248
+0.66
4.86%
jan 1, 1982
9.736
-4.512
-31.66%
jan 1, 1983
8.199
-1.538
-15.79%
jan 1, 1984
8.553
+0.354
4.32%
jan 1, 1985
10.191
+1.638
19.15%
jan 1, 1986
6.15
-4.041
-39.65%
jan 1, 1987
7.025
+0.875
14.23%
jan 1, 1988
7.999
+0.974
13.86%
jan 1, 1989
8.651
+0.652
8.16%
jan 1, 1990
8.157
-0.494
-5.71%
jan 1, 1991
9.964
+1.807
22.15%
jan 1, 1992
13.017
+3.053
30.64%
jan 1, 1993
9.199
-3.817
-29.32%
jan 1, 1994
11.675
+2.475
26.91%
jan 1, 1995
11.722
+0.048
0.41%
jan 1, 1996
11.132
-0.59
-5.03%
jan 1, 1997
8.9
-2.232
-20.05%
jan 1, 1998
8.924
+0.024
0.27%
jan 1, 1999
7.526
-1.398
-15.67%
jan 1, 2000
5.862
-1.664
-22.11%
jan 1, 2001
6.83
+0.968
16.51%
jan 1, 2002
5.038
-1.792
-26.24%
jan 1, 2003
4.945
-0.093
-1.85%
jan 1, 2004
5.126
+0.181
3.67%
jan 1, 2005
6.381
+1.255
24.48%
jan 1, 2006
6.323
-0.058
-0.91%
jan 1, 2007
8.399
+2.077
32.85%
jan 1, 2008
6.572
-1.828
-21.76%
jan 1, 2009
10.381
+3.809
57.96%
jan 1, 2010
3.543
-6.838
-65.87%
jan 1, 2011
7.436
+3.893
109.86%
jan 1, 2012
7.807
+0.371
4.99%
jan 1, 2013
5.346
-2.461
-31.53%
jan 1, 2014
4.133
-1.213
-22.69%
jan 1, 2015
4.292
+0.16
3.86%
jan 1, 2016
2.181
-2.112
-49.2%
Ranking of countries by current statistics by years


Comments: