29
/
en
AIzaSyAYiBZKx7MnpbEhh9jyipgxe19OcubqV5w
April 1, 2024
256481
Sweden
SWE
true
2
1
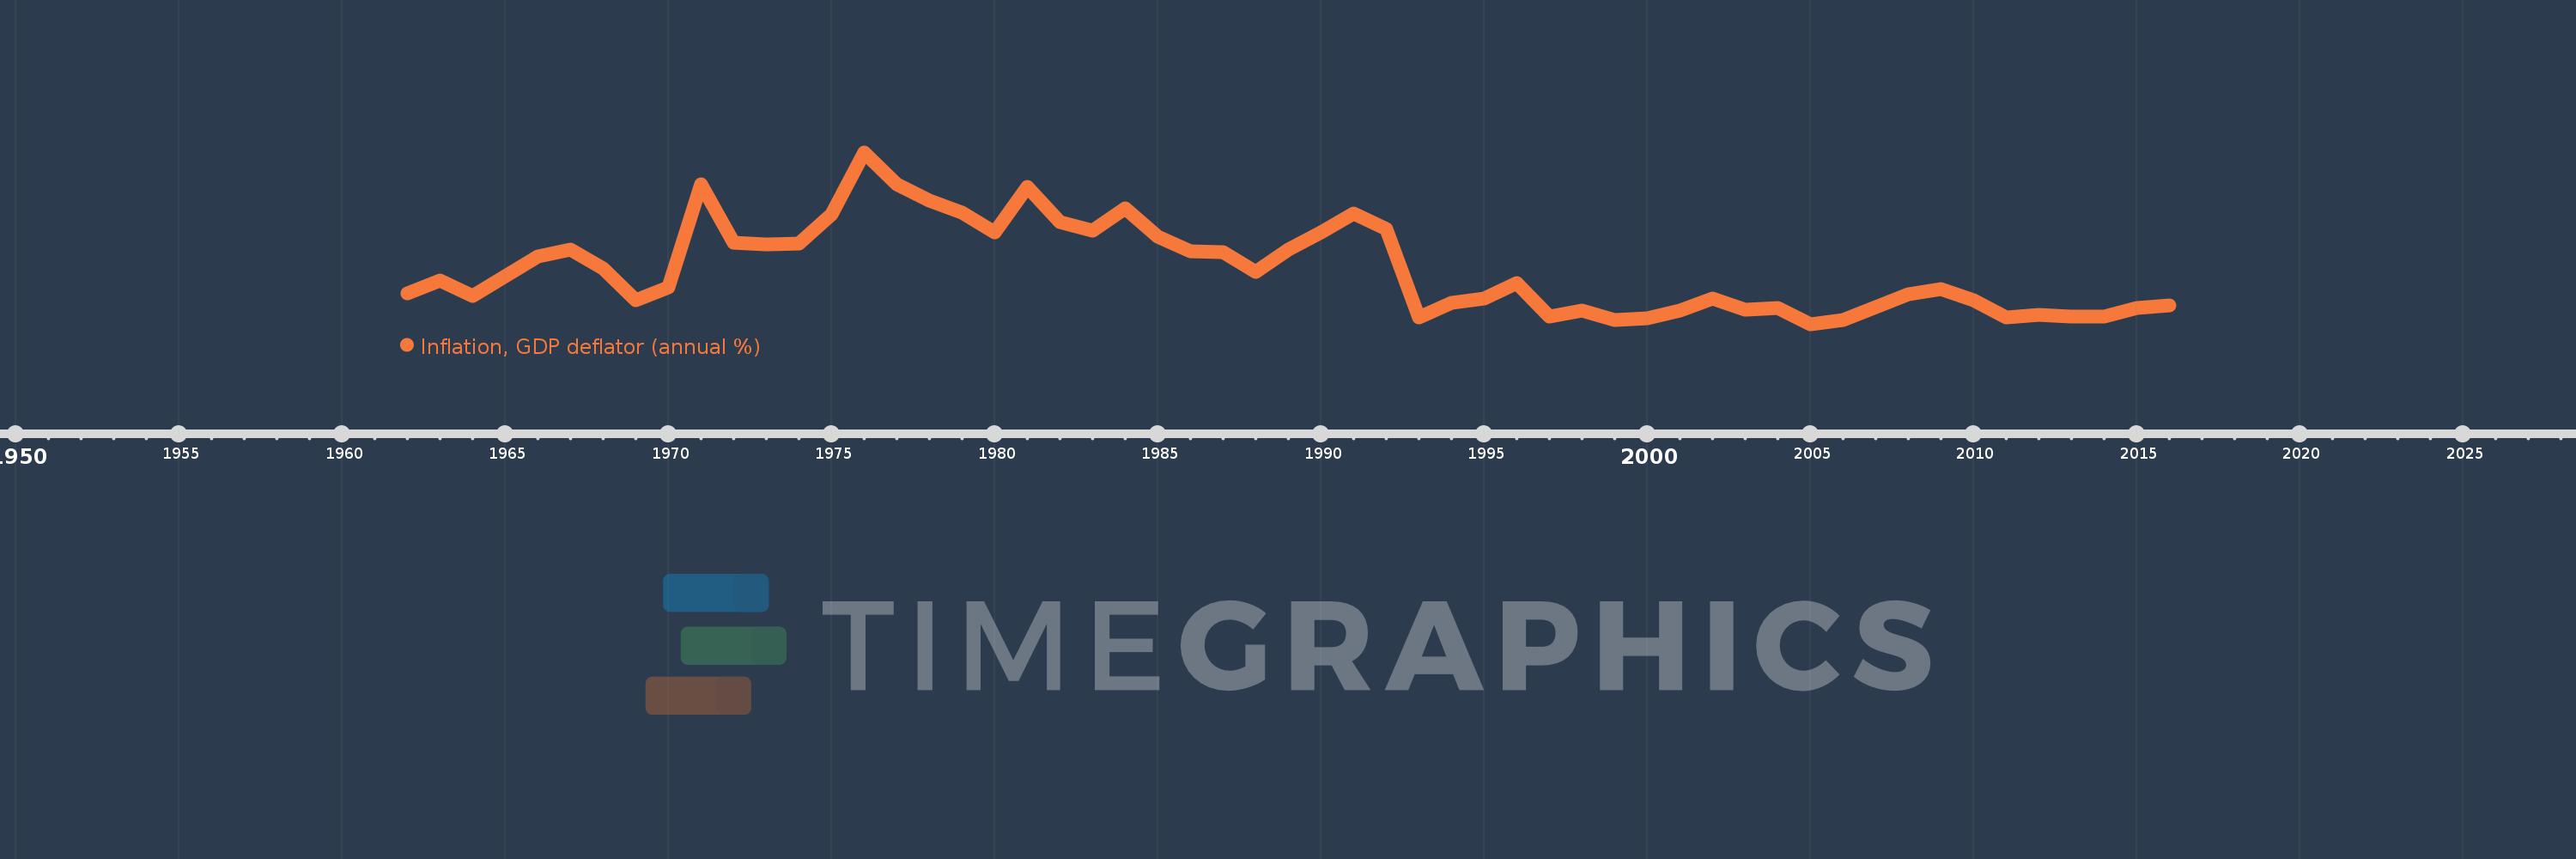
Inflation, GDP deflator (annual %)
2016,2015,2014,2013,2012,2011,2010,2009,2008,2007,2006,2005,2004,2003,2002,2001,2000,1999,1998,1997,1996,1995,1994,1993,1992,1991,1990,1989,1988,1987,1986,1985,1984,1983,1982,1981,1980,1979,1978,1977,1976,1975,1974,1973,1972,1971,1970,1969,1968,1967,1966,1965,1964,1963,1962
This statistics in other country:
AfghanistanAlbaniaAlgeriaAndorraAngolaAntigua and BarbudaArab WorldArgentinaArmeniaArubaAustraliaAustriaAzerbaijanBahamas, TheBahrainBangladeshBarbadosBelarusBelgiumBelizeBeninBermudaBhutanBoliviaBosnia and HerzegovinaBotswanaBrazilBrunei DarussalamBulgariaBurkina FasoBurundiCabo VerdeCambodiaCameroonCanadaCaribbean small statesCayman IslandsCentral African RepublicCentral Europe and the BalticsChadChannel IslandsChileChinaColombiaComorosCongo, Dem. Rep.Congo, Rep.Costa RicaCote d'IvoireCroatiaCubaCyprusCzech RepublicDenmarkDjiboutiDominicaDominican RepublicEarly-demographic dividendEast Asia & PacificEast Asia & Pacific (excluding high income)East Asia & Pacific (IDA & IBRD countries)EcuadorEgypt, Arab Rep.El SalvadorEquatorial GuineaEritreaEstoniaEthiopiaEuro areaEurope & Central AsiaEurope & Central Asia (excluding high income)Europe & Central Asia (IDA & IBRD countries)European UnionFijiFinlandFragile and conflict affected situationsFranceFrench PolynesiaGabonGambia, TheGeorgiaGermanyGhanaGreeceGreenlandGrenadaGuatemalaGuineaGuinea-BissauGuyanaHaitiHeavily indebted poor countries (HIPC)High incomeHondurasHong Kong SAR, ChinaHungaryIBRD onlyIcelandIDA & IBRD totalIDA blendIDA onlyIDA totalIndiaIndonesiaIran, Islamic Rep.IraqIrelandIsle of ManIsraelItalyJamaicaJapanJordanKazakhstanKenyaKiribatiKorea, Rep.KosovoKuwaitKyrgyz RepublicLao PDRLate-demographic dividendLatin America & Caribbean Latin America & Caribbean (excluding high income)Latin America & the Caribbean (IDA & IBRD countries)LatviaLeast developed countries: UN classificationLebanonLesothoLiberiaLibyaLiechtensteinLithuaniaLow & middle incomeLow incomeLower middle incomeLuxembourgMacao SAR, ChinaMacedonia, FYRMadagascarMalawiMalaysiaMaldivesMaliMaltaMarshall IslandsMauritaniaMauritiusMexicoMicronesia, Fed. Sts.Middle East & North AfricaMiddle East & North Africa (excluding high income)Middle East & North Africa (IDA & IBRD countries)Middle incomeMoldovaMonacoMongoliaMontenegroMoroccoMozambiqueMyanmarNamibiaNauruNepalNetherlandsNew CaledoniaNew ZealandNicaraguaNigerNigeriaNorth AmericaNorwayOECD membersOmanOther small statesPacific island small statesPakistanPalauPanamaPapua New GuineaParaguayPeruPhilippinesPolandPortugalPost-demographic dividendPre-demographic dividendPuerto RicoQatarRomaniaRussian FederationRwandaSamoaSan MarinoSao Tome and PrincipeSaudi ArabiaSenegalSerbiaSeychellesSierra LeoneSingaporeSlovak RepublicSloveniaSmall statesSolomon IslandsSomaliaSouth AfricaSouth AsiaSouth Asia (IDA & IBRD)South SudanSpainSri LankaSt. Kitts and NevisSt. LuciaSt. Vincent and the GrenadinesSub-Saharan Africa Sub-Saharan Africa (excluding high income)Sub-Saharan Africa (IDA & IBRD countries)SudanSurinameSwazilandSwedenSwitzerlandSyrian Arab RepublicTajikistanTanzaniaThailandTimor-LesteTogoTongaTrinidad and TobagoTunisiaTurkeyTurkmenistanTuvaluUgandaUkraineUnited Arab EmiratesUnited KingdomUnited StatesUpper middle incomeUruguayUzbekistanVanuatuVenezuela, RBVietnamVirgin Islands (U.S.)West Bank and GazaWorldYemen, Rep.ZambiaZimbabwe Timeline:
This timeline shows a graph from 1962 to 2016 of Sweden. No data until 1961. Number of actual observations by date: 55.
Source name:
World Development Indicators
Source organization:
World Bank national accounts data, and OECD National Accounts data files.
Categories, topics:
Economy & Growth
Last updated:
apr 23, 2017
Indicators value changes by year
Maximum:
14.512
jan 1, 1976
At the date of observation
Value
Absolute change
Change from previous value
jan 1, 1962
2.939
+2.939
0.0%
jan 1, 1963
4.019
+1.081
36.77%
jan 1, 1964
2.763
-1.256
-31.25%
jan 1, 1965
4.396
+1.633
59.11%
jan 1, 1966
5.994
+1.597
36.33%
jan 1, 1967
6.55
+0.556
9.28%
jan 1, 1968
5.008
-1.542
-23.54%
jan 1, 1969
2.392
-2.616
-52.24%
jan 1, 1970
3.417
+1.026
42.88%
jan 1, 1971
11.9
+8.483
248.22%
jan 1, 1972
7.11
-4.79
-40.25%
jan 1, 1973
6.973
-0.137
-1.93%
jan 1, 1974
7.034
+0.061
0.87%
jan 1, 1975
9.458
+2.424
34.47%
jan 1, 1976
14.512
+5.054
53.44%
jan 1, 1977
11.919
-2.593
-17.87%
jan 1, 1978
10.53
-1.389
-11.66%
jan 1, 1979
9.549
-0.981
-9.31%
jan 1, 1980
7.943
-1.606
-16.82%
jan 1, 1981
11.717
+3.773
47.5%
jan 1, 1982
8.767
-2.949
-25.17%
jan 1, 1983
8.085
-0.683
-7.79%
jan 1, 1984
9.954
+1.869
23.12%
jan 1, 1985
7.636
-2.318
-23.29%
jan 1, 1986
6.405
-1.231
-16.13%
jan 1, 1987
6.323
-0.082
-1.28%
jan 1, 1988
4.721
-1.602
-25.33%
jan 1, 1989
6.571
+1.85
39.19%
jan 1, 1990
7.925
+1.353
20.6%
jan 1, 1991
9.474
+1.549
19.55%
jan 1, 1992
8.247
-1.227
-12.95%
jan 1, 1993
1.015
-7.231
-87.69%
jan 1, 1994
2.212
+1.197
117.88%
jan 1, 1995
2.558
+0.345
15.62%
jan 1, 1996
3.798
+1.241
48.51%
jan 1, 1997
1.039
-2.759
-72.64%
jan 1, 1998
1.569
+0.53
50.99%
jan 1, 1999
0.78
-0.789
-50.26%
jan 1, 2000
0.935
+0.155
19.8%
jan 1, 2001
1.559
+0.624
66.71%
jan 1, 2002
2.505
+0.946
60.69%
jan 1, 2003
1.596
-0.909
-36.3%
jan 1, 2004
1.758
+0.163
10.19%
jan 1, 2005
0.429
-1.329
-75.59%
jan 1, 2006
0.804
+0.374
87.24%
jan 1, 2007
1.821
+1.017
126.6%
jan 1, 2008
2.885
+1.064
58.41%
jan 1, 2009
3.322
+0.437
15.14%
jan 1, 2010
2.383
-0.939
-28.26%
jan 1, 2011
0.991
-1.392
-58.42%
jan 1, 2012
1.184
+0.193
19.51%
jan 1, 2013
1.061
-0.123
-10.39%
jan 1, 2014
1.055
-0.006
-0.54%
jan 1, 2015
1.777
+0.722
68.4%
jan 1, 2016
1.984
+0.206
11.61%
Ranking of countries by current statistics by years


Comments: