29
/
en
AIzaSyAYiBZKx7MnpbEhh9jyipgxe19OcubqV5w
April 1, 2024
77249
Bahrain
BHR
true
2
1
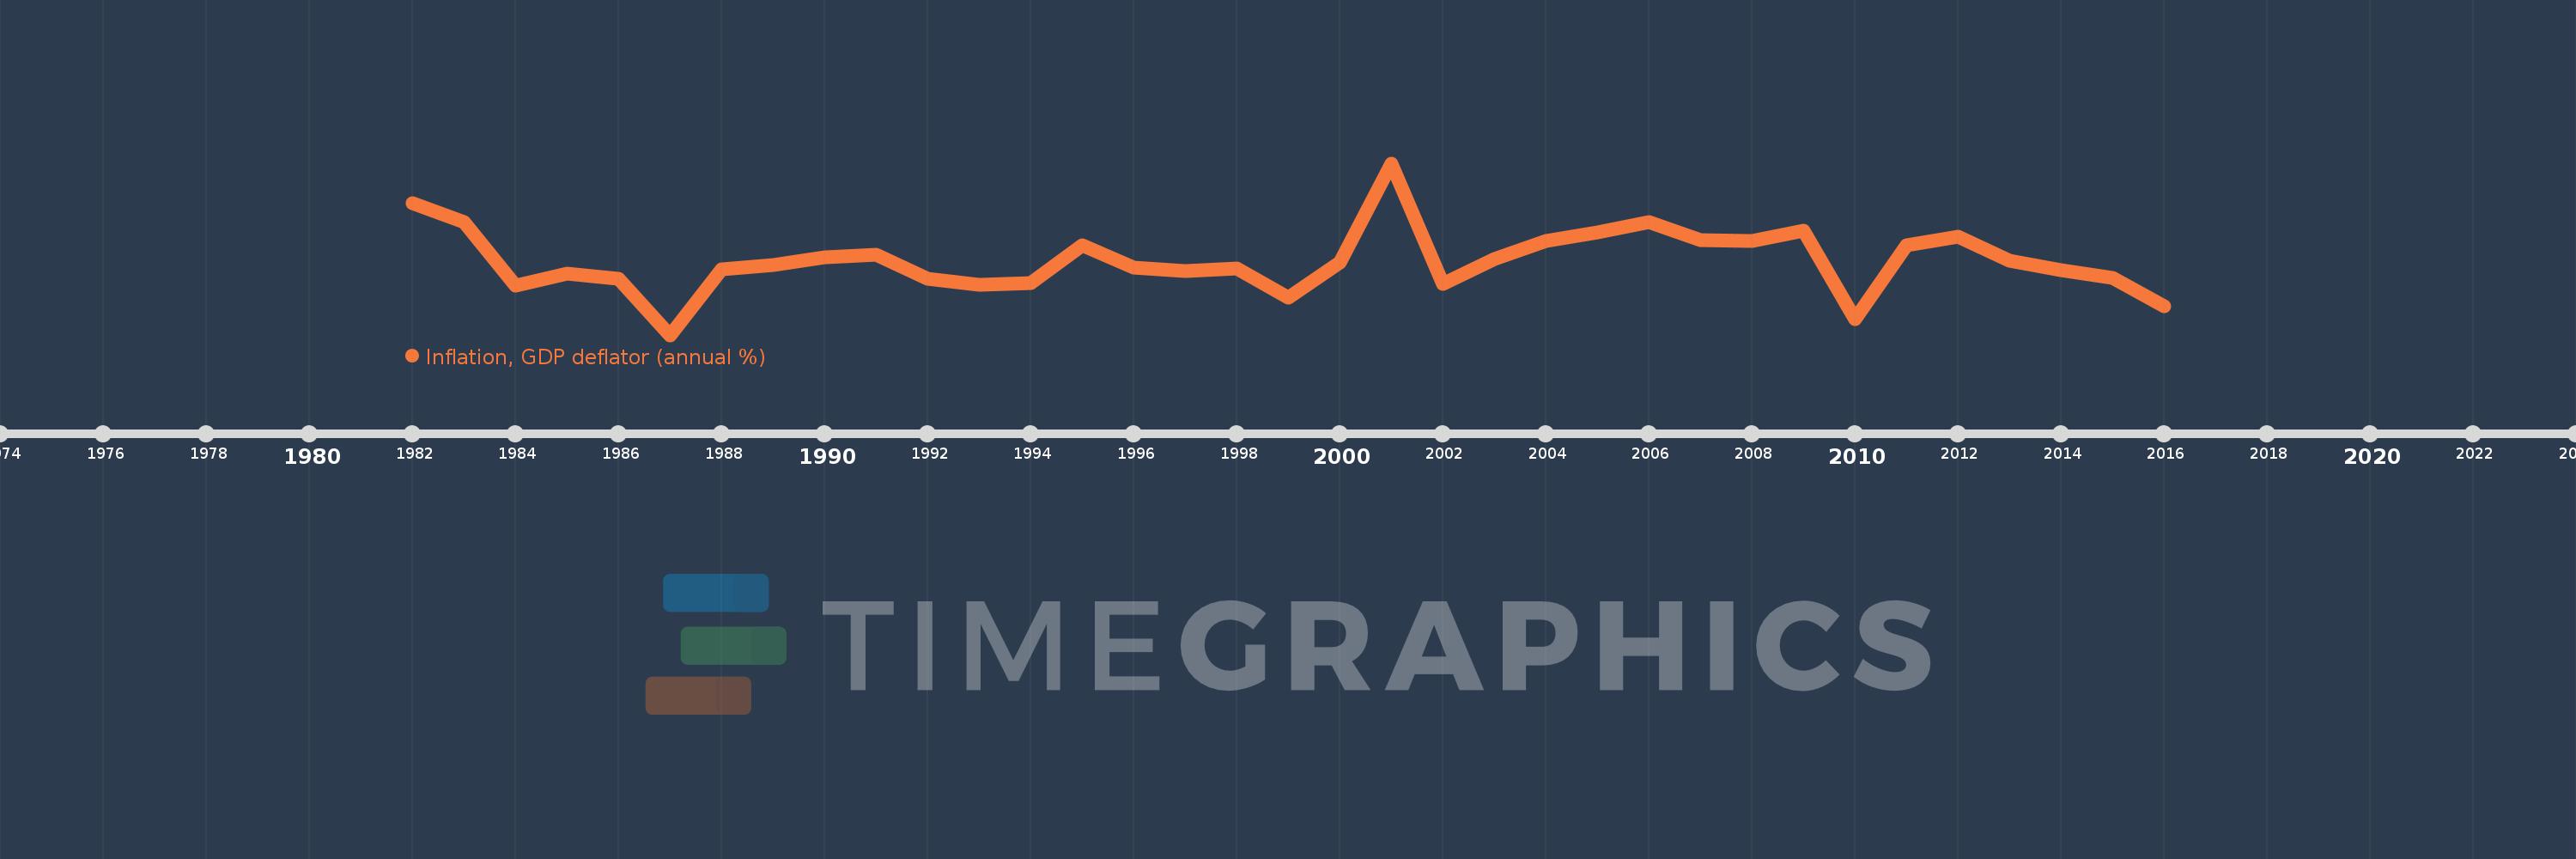
Inflation, GDP deflator (annual %)
2016,2015,2014,2013,2012,2011,2010,2009,2008,2007,2006,2005,2004,2003,2002,2001,2000,1999,1998,1997,1996,1995,1994,1993,1992,1991,1990,1989,1988,1987,1986,1985,1984,1983,1982
This statistics in other country:
AfghanistanAlbaniaAlgeriaAndorraAngolaAntigua and BarbudaArab WorldArgentinaArmeniaArubaAustraliaAustriaAzerbaijanBahamas, TheBahrainBangladeshBarbadosBelarusBelgiumBelizeBeninBermudaBhutanBoliviaBosnia and HerzegovinaBotswanaBrazilBrunei DarussalamBulgariaBurkina FasoBurundiCabo VerdeCambodiaCameroonCanadaCaribbean small statesCayman IslandsCentral African RepublicCentral Europe and the BalticsChadChannel IslandsChileChinaColombiaComorosCongo, Dem. Rep.Congo, Rep.Costa RicaCote d'IvoireCroatiaCubaCyprusCzech RepublicDenmarkDjiboutiDominicaDominican RepublicEarly-demographic dividendEast Asia & PacificEast Asia & Pacific (excluding high income)East Asia & Pacific (IDA & IBRD countries)EcuadorEgypt, Arab Rep.El SalvadorEquatorial GuineaEritreaEstoniaEthiopiaEuro areaEurope & Central AsiaEurope & Central Asia (excluding high income)Europe & Central Asia (IDA & IBRD countries)European UnionFijiFinlandFragile and conflict affected situationsFranceFrench PolynesiaGabonGambia, TheGeorgiaGermanyGhanaGreeceGreenlandGrenadaGuatemalaGuineaGuinea-BissauGuyanaHaitiHeavily indebted poor countries (HIPC)High incomeHondurasHong Kong SAR, ChinaHungaryIBRD onlyIcelandIDA & IBRD totalIDA blendIDA onlyIDA totalIndiaIndonesiaIran, Islamic Rep.IraqIrelandIsle of ManIsraelItalyJamaicaJapanJordanKazakhstanKenyaKiribatiKorea, Rep.KosovoKuwaitKyrgyz RepublicLao PDRLate-demographic dividendLatin America & Caribbean Latin America & Caribbean (excluding high income)Latin America & the Caribbean (IDA & IBRD countries)LatviaLeast developed countries: UN classificationLebanonLesothoLiberiaLibyaLiechtensteinLithuaniaLow & middle incomeLow incomeLower middle incomeLuxembourgMacao SAR, ChinaMacedonia, FYRMadagascarMalawiMalaysiaMaldivesMaliMaltaMarshall IslandsMauritaniaMauritiusMexicoMicronesia, Fed. Sts.Middle East & North AfricaMiddle East & North Africa (excluding high income)Middle East & North Africa (IDA & IBRD countries)Middle incomeMoldovaMonacoMongoliaMontenegroMoroccoMozambiqueMyanmarNamibiaNauruNepalNetherlandsNew CaledoniaNew ZealandNicaraguaNigerNigeriaNorth AmericaNorwayOECD membersOmanOther small statesPacific island small statesPakistanPalauPanamaPapua New GuineaParaguayPeruPhilippinesPolandPortugalPost-demographic dividendPre-demographic dividendPuerto RicoQatarRomaniaRussian FederationRwandaSamoaSan MarinoSao Tome and PrincipeSaudi ArabiaSenegalSerbiaSeychellesSierra LeoneSingaporeSlovak RepublicSloveniaSmall statesSolomon IslandsSomaliaSouth AfricaSouth AsiaSouth Asia (IDA & IBRD)South SudanSpainSri LankaSt. Kitts and NevisSt. LuciaSt. Vincent and the GrenadinesSub-Saharan Africa Sub-Saharan Africa (excluding high income)Sub-Saharan Africa (IDA & IBRD countries)SudanSurinameSwazilandSwedenSwitzerlandSyrian Arab RepublicTajikistanTanzaniaThailandTimor-LesteTogoTongaTrinidad and TobagoTunisiaTurkeyTurkmenistanTuvaluUgandaUkraineUnited Arab EmiratesUnited KingdomUnited StatesUpper middle incomeUruguayUzbekistanVanuatuVenezuela, RBVietnamVirgin Islands (U.S.)West Bank and GazaWorldYemen, Rep.ZambiaZimbabwe Timeline:
This timeline shows a graph from 1982 to 2016 of Bahrain. No data until 1981. Number of actual observations by date: 35.
Source name:
World Development Indicators
Source organization:
World Bank national accounts data, and OECD National Accounts data files.
Categories, topics:
Economy & Growth
Last updated:
apr 23, 2017
Indicators value changes by year
Minimum:
-17.393
jan 1, 1987
Maximum:
29.991
jan 1, 2001
At the date of observation
Value
Absolute change
Change from previous value
jan 1, 1982
18.912
+18.912
0.0%
jan 1, 1983
13.724
-5.188
-27.43%
jan 1, 1984
-3.69
-17.414
-126.89%
jan 1, 1985
-0.418
+3.271
-88.66%
jan 1, 1986
-1.825
-1.407
336.1%
jan 1, 1987
-17.393
-15.568
853.02%
jan 1, 1988
0.659
+18.052
-103.79%
jan 1, 1989
2.009
+1.35
204.9%
jan 1, 1990
3.975
+1.965
97.8%
jan 1, 1991
4.827
+0.852
21.44%
jan 1, 1992
-1.883
-6.709
-139.0%
jan 1, 1993
-3.533
-1.65
87.66%
jan 1, 1994
-3.026
+0.507
-14.35%
jan 1, 1995
7.331
+10.357
-342.29%
jan 1, 1996
1.091
-6.241
-85.12%
jan 1, 1997
0.197
-0.894
-81.96%
jan 1, 1998
0.932
+0.735
373.62%
jan 1, 1999
-7.057
-7.989
-857.46%
jan 1, 2000
2.656
+9.714
-137.64%
jan 1, 2001
29.991
+27.335
1.03K%
jan 1, 2002
-3.364
-33.355
-111.22%
jan 1, 2003
3.565
+6.929
-205.97%
jan 1, 2004
8.445
+4.88
136.91%
jan 1, 2005
10.991
+2.546
30.15%
jan 1, 2006
13.735
+2.744
24.96%
jan 1, 2007
8.843
-4.892
-35.62%
jan 1, 2008
8.435
-0.407
-4.6%
jan 1, 2009
11.365
+2.929
34.73%
jan 1, 2010
-12.994
-24.359
-214.33%
jan 1, 2011
7.441
+20.435
-157.27%
jan 1, 2012
9.737
+2.296
30.85%
jan 1, 2013
3.015
-6.722
-69.04%
jan 1, 2014
0.384
-2.631
-87.26%
jan 1, 2015
-1.671
-2.055
-535.06%
jan 1, 2016
-9.369
-7.698
460.73%
Ranking of countries by current statistics by years


Comments: