29
/
en
AIzaSyAYiBZKx7MnpbEhh9jyipgxe19OcubqV5w
April 1, 2024
238403
Seychelles
SYC
true
2
1
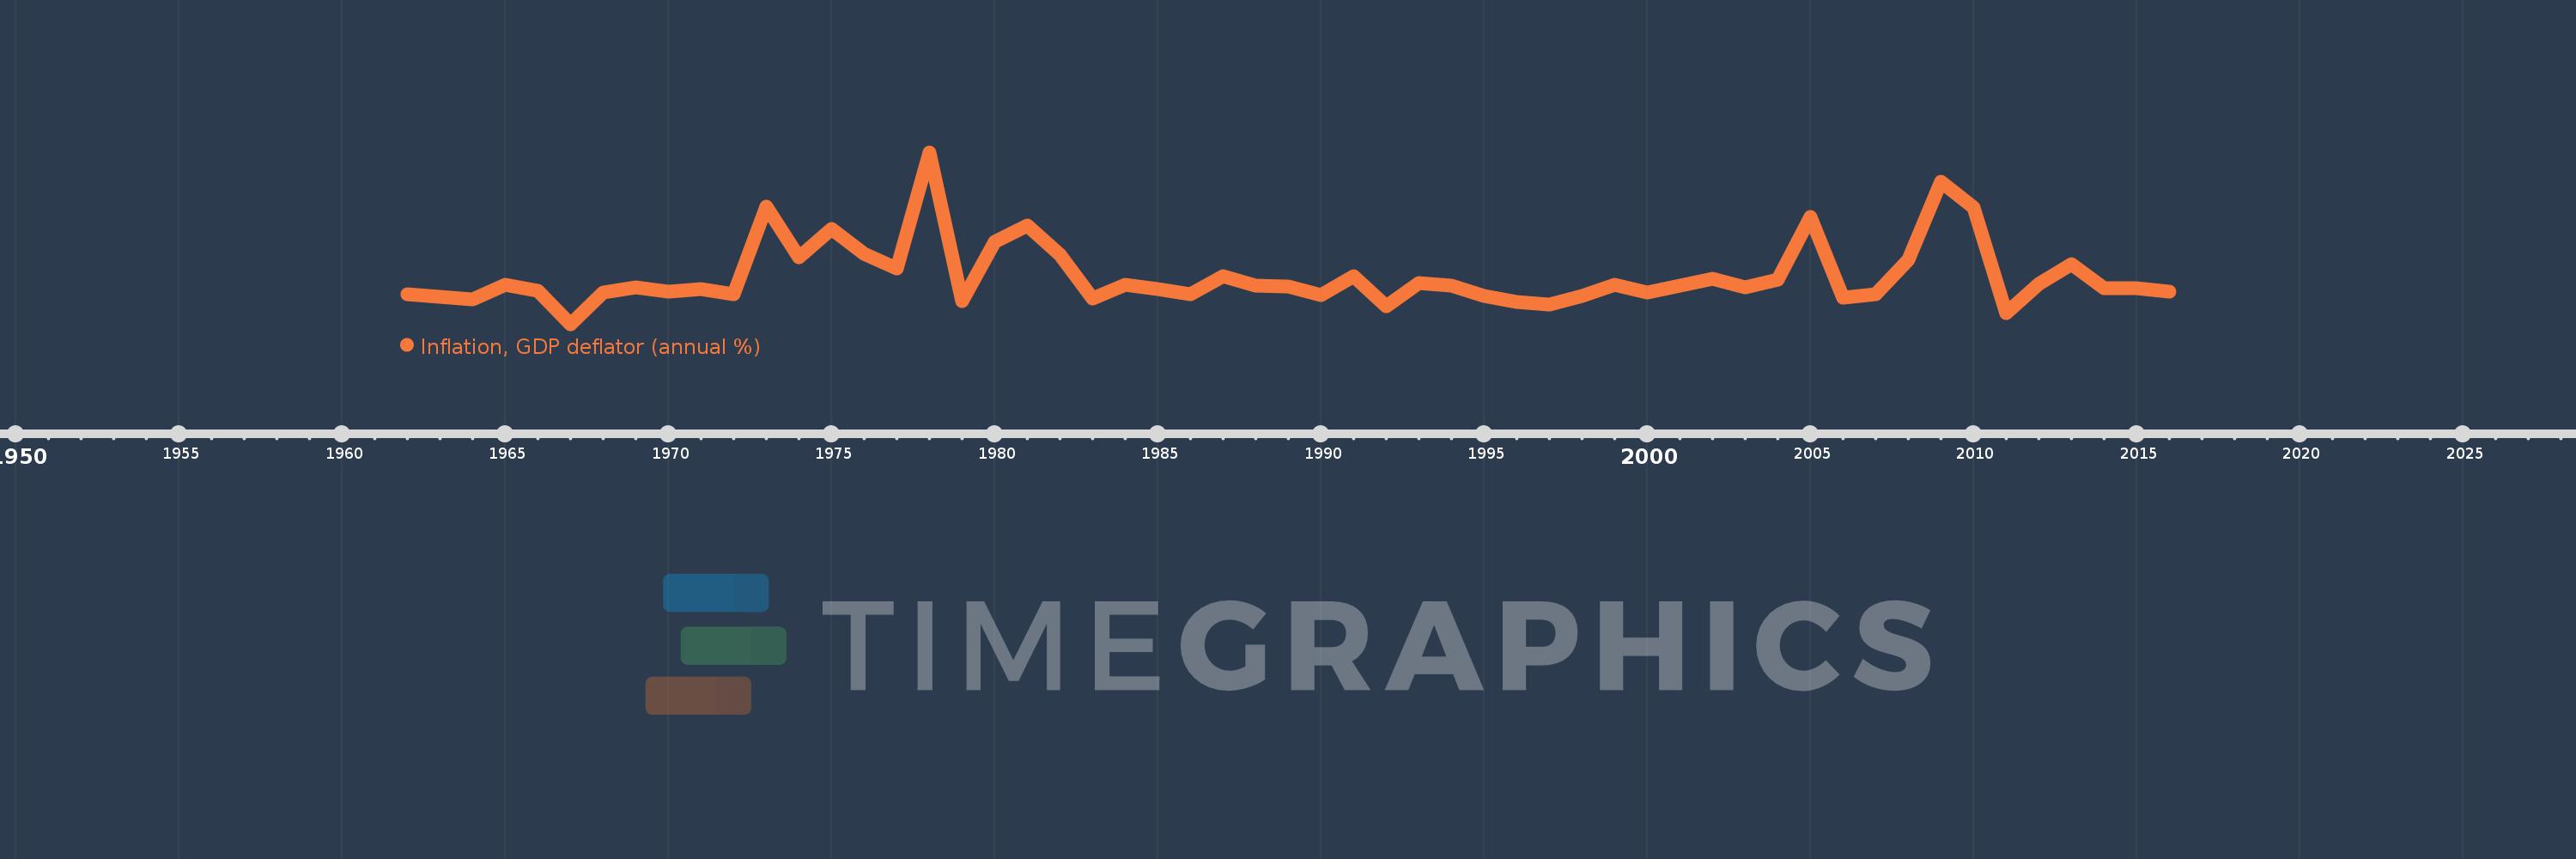
Inflation, GDP deflator (annual %)
2016,2015,2014,2013,2012,2011,2010,2009,2008,2007,2006,2005,2004,2003,2002,2001,2000,1999,1998,1997,1996,1995,1994,1993,1992,1991,1990,1989,1988,1987,1986,1985,1984,1983,1982,1981,1980,1979,1978,1977,1976,1975,1974,1973,1972,1971,1970,1969,1968,1967,1966,1965,1964,1963,1962
This statistics in other country:
AfghanistanAlbaniaAlgeriaAndorraAngolaAntigua and BarbudaArab WorldArgentinaArmeniaArubaAustraliaAustriaAzerbaijanBahamas, TheBahrainBangladeshBarbadosBelarusBelgiumBelizeBeninBermudaBhutanBoliviaBosnia and HerzegovinaBotswanaBrazilBrunei DarussalamBulgariaBurkina FasoBurundiCabo VerdeCambodiaCameroonCanadaCaribbean small statesCayman IslandsCentral African RepublicCentral Europe and the BalticsChadChannel IslandsChileChinaColombiaComorosCongo, Dem. Rep.Congo, Rep.Costa RicaCote d'IvoireCroatiaCubaCyprusCzech RepublicDenmarkDjiboutiDominicaDominican RepublicEarly-demographic dividendEast Asia & PacificEast Asia & Pacific (excluding high income)East Asia & Pacific (IDA & IBRD countries)EcuadorEgypt, Arab Rep.El SalvadorEquatorial GuineaEritreaEstoniaEthiopiaEuro areaEurope & Central AsiaEurope & Central Asia (excluding high income)Europe & Central Asia (IDA & IBRD countries)European UnionFijiFinlandFragile and conflict affected situationsFranceFrench PolynesiaGabonGambia, TheGeorgiaGermanyGhanaGreeceGreenlandGrenadaGuatemalaGuineaGuinea-BissauGuyanaHaitiHeavily indebted poor countries (HIPC)High incomeHondurasHong Kong SAR, ChinaHungaryIBRD onlyIcelandIDA & IBRD totalIDA blendIDA onlyIDA totalIndiaIndonesiaIran, Islamic Rep.IraqIrelandIsle of ManIsraelItalyJamaicaJapanJordanKazakhstanKenyaKiribatiKorea, Rep.KosovoKuwaitKyrgyz RepublicLao PDRLate-demographic dividendLatin America & Caribbean Latin America & Caribbean (excluding high income)Latin America & the Caribbean (IDA & IBRD countries)LatviaLeast developed countries: UN classificationLebanonLesothoLiberiaLibyaLiechtensteinLithuaniaLow & middle incomeLow incomeLower middle incomeLuxembourgMacao SAR, ChinaMacedonia, FYRMadagascarMalawiMalaysiaMaldivesMaliMaltaMarshall IslandsMauritaniaMauritiusMexicoMicronesia, Fed. Sts.Middle East & North AfricaMiddle East & North Africa (excluding high income)Middle East & North Africa (IDA & IBRD countries)Middle incomeMoldovaMonacoMongoliaMontenegroMoroccoMozambiqueMyanmarNamibiaNauruNepalNetherlandsNew CaledoniaNew ZealandNicaraguaNigerNigeriaNorth AmericaNorwayOECD membersOmanOther small statesPacific island small statesPakistanPalauPanamaPapua New GuineaParaguayPeruPhilippinesPolandPortugalPost-demographic dividendPre-demographic dividendPuerto RicoQatarRomaniaRussian FederationRwandaSamoaSan MarinoSao Tome and PrincipeSaudi ArabiaSenegalSerbiaSeychellesSierra LeoneSingaporeSlovak RepublicSloveniaSmall statesSolomon IslandsSomaliaSouth AfricaSouth AsiaSouth Asia (IDA & IBRD)South SudanSpainSri LankaSt. Kitts and NevisSt. LuciaSt. Vincent and the GrenadinesSub-Saharan Africa Sub-Saharan Africa (excluding high income)Sub-Saharan Africa (IDA & IBRD countries)SudanSurinameSwazilandSwedenSwitzerlandSyrian Arab RepublicTajikistanTanzaniaThailandTimor-LesteTogoTongaTrinidad and TobagoTunisiaTurkeyTurkmenistanTuvaluUgandaUkraineUnited Arab EmiratesUnited KingdomUnited StatesUpper middle incomeUruguayUzbekistanVanuatuVenezuela, RBVietnamVirgin Islands (U.S.)West Bank and GazaWorldYemen, Rep.ZambiaZimbabwe Timeline:
This timeline shows a graph from 1962 to 2016 of Seychelles. No data until 1961. Number of actual observations by date: 55.
Source name:
World Development Indicators
Source organization:
World Bank national accounts data, and OECD National Accounts data files.
Categories, topics:
Economy & Growth
Last updated:
apr 23, 2017
Indicators value changes by year
Minimum:
-7.474
jan 1, 1967
Maximum:
43.805
jan 1, 1978
At the date of observation
Value
Absolute change
Change from previous value
jan 1, 1962
1.457
+1.457
0.0%
jan 1, 1963
0.599
-0.858
-58.88%
jan 1, 1964
-0.002
-0.601
-100.41%
jan 1, 1965
4.38
+4.382
-177.92K%
jan 1, 1966
2.451
-1.929
-44.04%
jan 1, 1967
-7.474
-9.925
-404.97%
jan 1, 1968
2.039
+9.514
-127.28%
jan 1, 1969
3.398
+1.359
66.63%
jan 1, 1970
2.352
-1.046
-30.8%
jan 1, 1971
2.905
+0.554
23.55%
jan 1, 1972
1.574
-1.331
-45.81%
jan 1, 1973
27.711
+26.137
1.66K%
jan 1, 1974
12.548
-15.163
-54.72%
jan 1, 1975
20.934
+8.386
66.83%
jan 1, 1976
13.507
-7.427
-35.48%
jan 1, 1977
9.134
-4.373
-32.38%
jan 1, 1978
43.805
+34.671
379.58%
jan 1, 1979
-0.455
-44.26
-101.04%
jan 1, 1980
17.01
+17.465
-3.84K%
jan 1, 1981
22.061
+5.051
29.7%
jan 1, 1982
13.149
-8.912
-40.4%
jan 1, 1983
0.2
-12.949
-98.48%
jan 1, 1984
4.227
+4.027
2.01K%
jan 1, 1985
2.93
-1.296
-30.67%
jan 1, 1986
1.514
-1.417
-48.35%
jan 1, 1987
6.741
+5.227
345.36%
jan 1, 1988
4.141
-2.6
-38.57%
jan 1, 1989
3.859
-0.282
-6.8%
jan 1, 1990
1.287
-2.572
-66.65%
jan 1, 1991
6.827
+5.54
430.39%
jan 1, 1992
-2.043
-8.87
-129.93%
jan 1, 1993
4.68
+6.723
-329.04%
jan 1, 1994
4.102
-0.578
-12.34%
jan 1, 1995
0.961
-3.141
-76.57%
jan 1, 1996
-0.779
-1.74
-181.02%
jan 1, 1997
-1.532
-0.754
96.78%
jan 1, 1998
1.084
+2.616
-170.72%
jan 1, 1999
4.366
+3.282
302.84%
jan 1, 2000
2.057
-2.309
-52.89%
jan 1, 2001
3.984
+1.927
93.7%
jan 1, 2002
6.157
+2.173
54.55%
jan 1, 2003
3.613
-2.544
-41.31%
jan 1, 2004
5.947
+2.334
64.59%
jan 1, 2005
24.674
+18.727
314.91%
jan 1, 2006
0.459
-24.215
-98.14%
jan 1, 2007
1.442
+0.984
214.48%
jan 1, 2008
11.8
+10.357
718.1%
jan 1, 2009
34.965
+23.165
196.32%
jan 1, 2010
27.494
-7.471
-21.37%
jan 1, 2011
-4.213
-31.707
-115.32%
jan 1, 2012
4.496
+8.709
-206.73%
jan 1, 2013
10.49
+5.993
133.3%
jan 1, 2014
3.219
-7.271
-69.31%
jan 1, 2015
3.149
-0.07
-2.16%
jan 1, 2016
2.135
-1.014
-32.2%
Ranking of countries by current statistics by years


Comments: