29
/
en
AIzaSyAYiBZKx7MnpbEhh9jyipgxe19OcubqV5w
April 1, 2024
192334
Marshall Islands
MHL
true
2
1
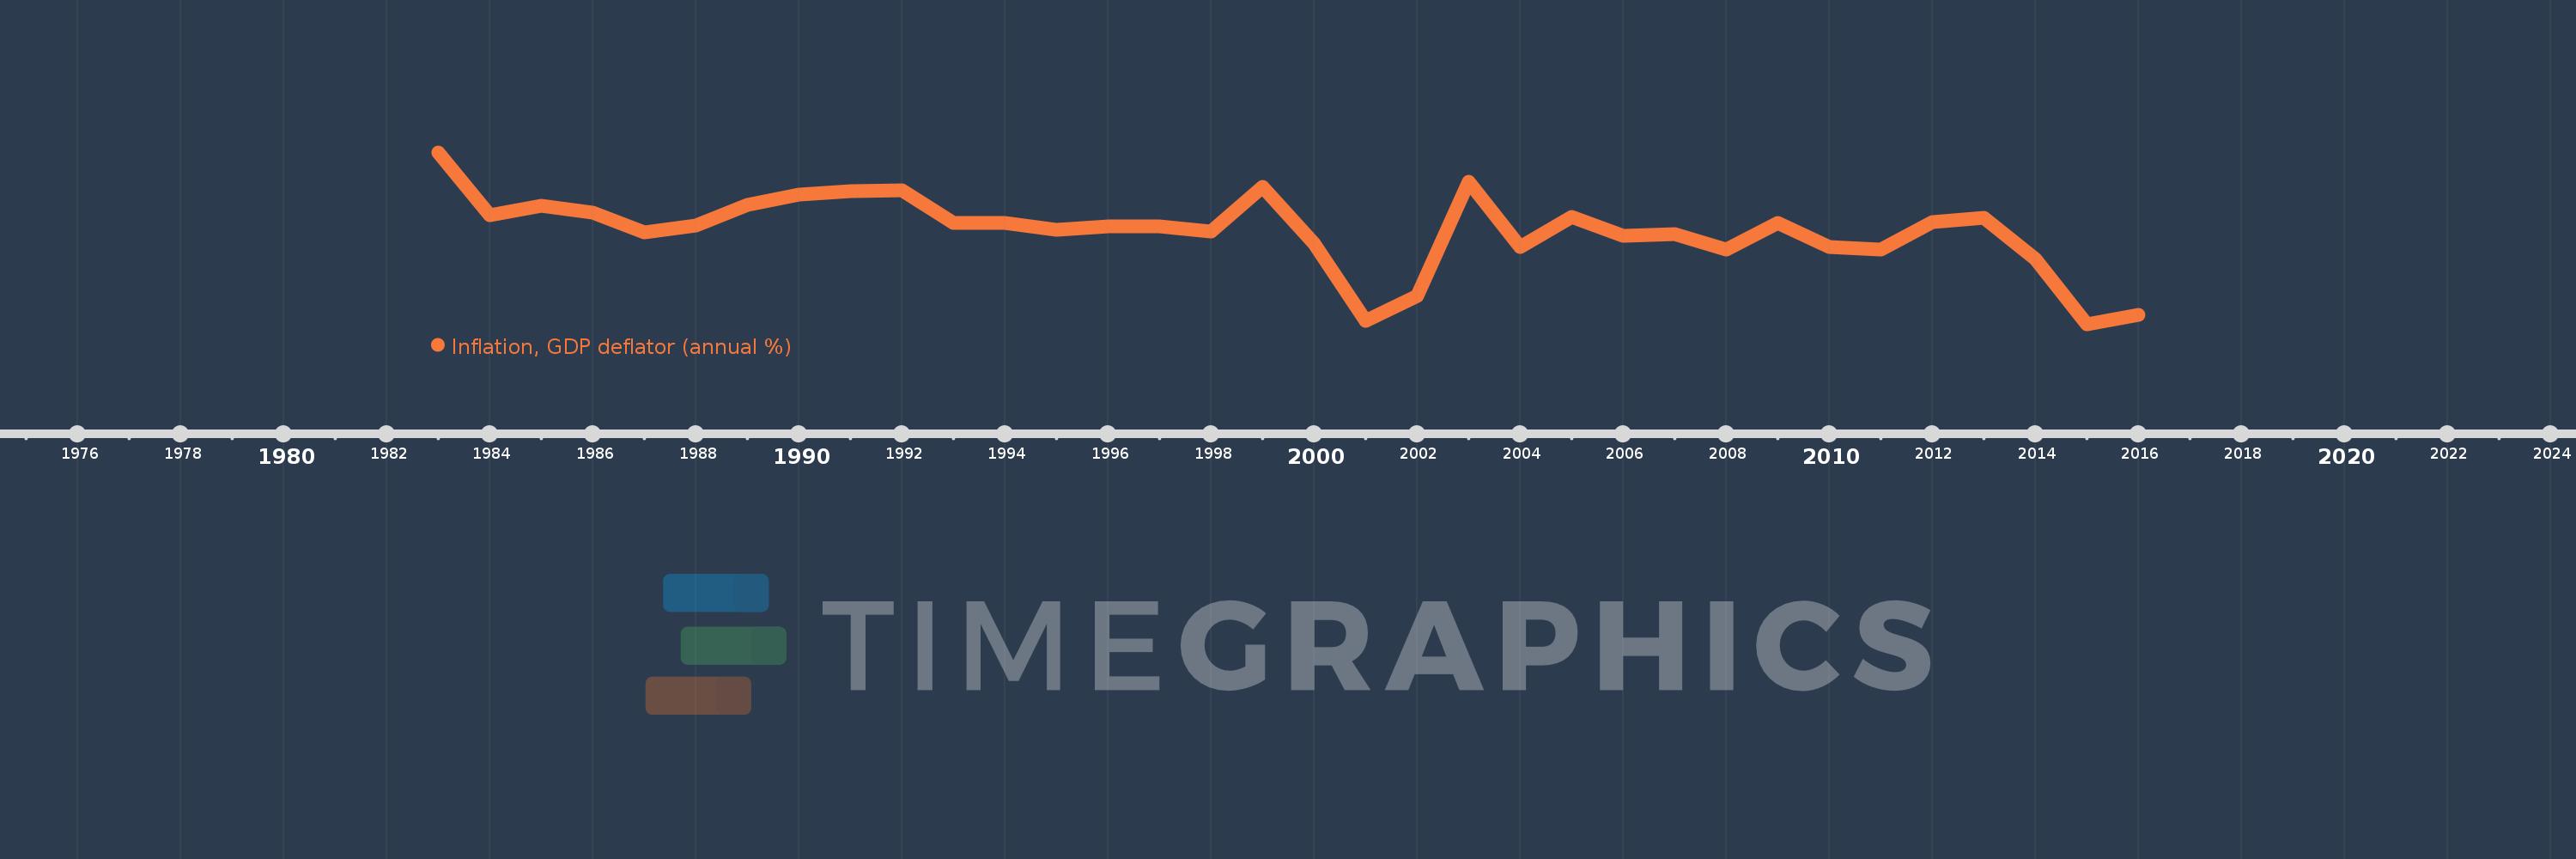
Inflation, GDP deflator (annual %)
2016,2015,2014,2013,2012,2011,2010,2009,2008,2007,2006,2005,2004,2003,2002,2001,2000,1999,1998,1997,1996,1995,1994,1993,1992,1991,1990,1989,1988,1987,1986,1985,1984,1983
This statistics in other country:
AfghanistanAlbaniaAlgeriaAndorraAngolaAntigua and BarbudaArab WorldArgentinaArmeniaArubaAustraliaAustriaAzerbaijanBahamas, TheBahrainBangladeshBarbadosBelarusBelgiumBelizeBeninBermudaBhutanBoliviaBosnia and HerzegovinaBotswanaBrazilBrunei DarussalamBulgariaBurkina FasoBurundiCabo VerdeCambodiaCameroonCanadaCaribbean small statesCayman IslandsCentral African RepublicCentral Europe and the BalticsChadChannel IslandsChileChinaColombiaComorosCongo, Dem. Rep.Congo, Rep.Costa RicaCote d'IvoireCroatiaCubaCyprusCzech RepublicDenmarkDjiboutiDominicaDominican RepublicEarly-demographic dividendEast Asia & PacificEast Asia & Pacific (excluding high income)East Asia & Pacific (IDA & IBRD countries)EcuadorEgypt, Arab Rep.El SalvadorEquatorial GuineaEritreaEstoniaEthiopiaEuro areaEurope & Central AsiaEurope & Central Asia (excluding high income)Europe & Central Asia (IDA & IBRD countries)European UnionFijiFinlandFragile and conflict affected situationsFranceFrench PolynesiaGabonGambia, TheGeorgiaGermanyGhanaGreeceGreenlandGrenadaGuatemalaGuineaGuinea-BissauGuyanaHaitiHeavily indebted poor countries (HIPC)High incomeHondurasHong Kong SAR, ChinaHungaryIBRD onlyIcelandIDA & IBRD totalIDA blendIDA onlyIDA totalIndiaIndonesiaIran, Islamic Rep.IraqIrelandIsle of ManIsraelItalyJamaicaJapanJordanKazakhstanKenyaKiribatiKorea, Rep.KosovoKuwaitKyrgyz RepublicLao PDRLate-demographic dividendLatin America & Caribbean Latin America & Caribbean (excluding high income)Latin America & the Caribbean (IDA & IBRD countries)LatviaLeast developed countries: UN classificationLebanonLesothoLiberiaLibyaLiechtensteinLithuaniaLow & middle incomeLow incomeLower middle incomeLuxembourgMacao SAR, ChinaMacedonia, FYRMadagascarMalawiMalaysiaMaldivesMaliMaltaMarshall IslandsMauritaniaMauritiusMexicoMicronesia, Fed. Sts.Middle East & North AfricaMiddle East & North Africa (excluding high income)Middle East & North Africa (IDA & IBRD countries)Middle incomeMoldovaMonacoMongoliaMontenegroMoroccoMozambiqueMyanmarNamibiaNauruNepalNetherlandsNew CaledoniaNew ZealandNicaraguaNigerNigeriaNorth AmericaNorwayOECD membersOmanOther small statesPacific island small statesPakistanPalauPanamaPapua New GuineaParaguayPeruPhilippinesPolandPortugalPost-demographic dividendPre-demographic dividendPuerto RicoQatarRomaniaRussian FederationRwandaSamoaSan MarinoSao Tome and PrincipeSaudi ArabiaSenegalSerbiaSeychellesSierra LeoneSingaporeSlovak RepublicSloveniaSmall statesSolomon IslandsSomaliaSouth AfricaSouth AsiaSouth Asia (IDA & IBRD)South SudanSpainSri LankaSt. Kitts and NevisSt. LuciaSt. Vincent and the GrenadinesSub-Saharan Africa Sub-Saharan Africa (excluding high income)Sub-Saharan Africa (IDA & IBRD countries)SudanSurinameSwazilandSwedenSwitzerlandSyrian Arab RepublicTajikistanTanzaniaThailandTimor-LesteTogoTongaTrinidad and TobagoTunisiaTurkeyTurkmenistanTuvaluUgandaUkraineUnited Arab EmiratesUnited KingdomUnited StatesUpper middle incomeUruguayUzbekistanVanuatuVenezuela, RBVietnamVirgin Islands (U.S.)West Bank and GazaWorldYemen, Rep.ZambiaZimbabwe Timeline:
This timeline shows a graph from 1983 to 2016 of Marshall Islands. No data until 1982. Number of actual observations by date: 34.
Source name:
World Development Indicators
Source organization:
World Bank national accounts data, and OECD National Accounts data files.
Categories, topics:
Economy & Growth
Last updated:
apr 23, 2017
Indicators value changes by year
Minimum:
-3.205
jan 1, 2015
At the date of observation
Value
Absolute change
Change from previous value
jan 1, 1983
7.378
+7.378
0.0%
jan 1, 1984
3.511
-3.868
-52.42%
jan 1, 1985
4.107
+0.597
16.99%
jan 1, 1986
3.686
-0.421
-10.26%
jan 1, 1987
2.454
-1.232
-33.42%
jan 1, 1988
2.86
+0.406
16.56%
jan 1, 1989
4.123
+1.263
44.16%
jan 1, 1990
4.757
+0.634
15.37%
jan 1, 1991
4.99
+0.233
4.89%
jan 1, 1992
5.044
+0.054
1.09%
jan 1, 1993
3.014
-2.03
-40.25%
jan 1, 1994
3.034
+0.02
0.65%
jan 1, 1995
2.625
-0.409
-13.48%
jan 1, 1996
2.807
+0.182
6.95%
jan 1, 1997
2.796
-0.011
-0.4%
jan 1, 1998
2.484
-0.312
-11.14%
jan 1, 1999
5.264
+2.78
111.89%
jan 1, 2000
1.774
-3.49
-66.29%
jan 1, 2001
-2.975
-4.75
-267.68%
jan 1, 2002
-1.485
+1.49
-50.09%
jan 1, 2003
5.561
+7.046
-474.5%
jan 1, 2004
1.553
-4.008
-72.07%
jan 1, 2005
3.382
+1.829
117.8%
jan 1, 2006
2.251
-1.131
-33.44%
jan 1, 2007
2.324
+0.073
3.24%
jan 1, 2008
1.404
-0.92
-39.59%
jan 1, 2009
3.044
+1.64
116.85%
jan 1, 2010
1.56
-1.485
-48.77%
jan 1, 2011
1.412
-0.148
-9.46%
jan 1, 2012
3.081
+1.669
118.18%
jan 1, 2013
3.346
+0.266
8.62%
jan 1, 2014
0.829
-2.517
-75.22%
jan 1, 2015
-3.205
-4.035
-486.61%
jan 1, 2016
-2.628
+0.577
-18.01%
Ranking of countries by current statistics by years


Comments: