29
/
en
AIzaSyAYiBZKx7MnpbEhh9jyipgxe19OcubqV5w
April 1, 2024
277822
Uruguay
URY
true
2
1
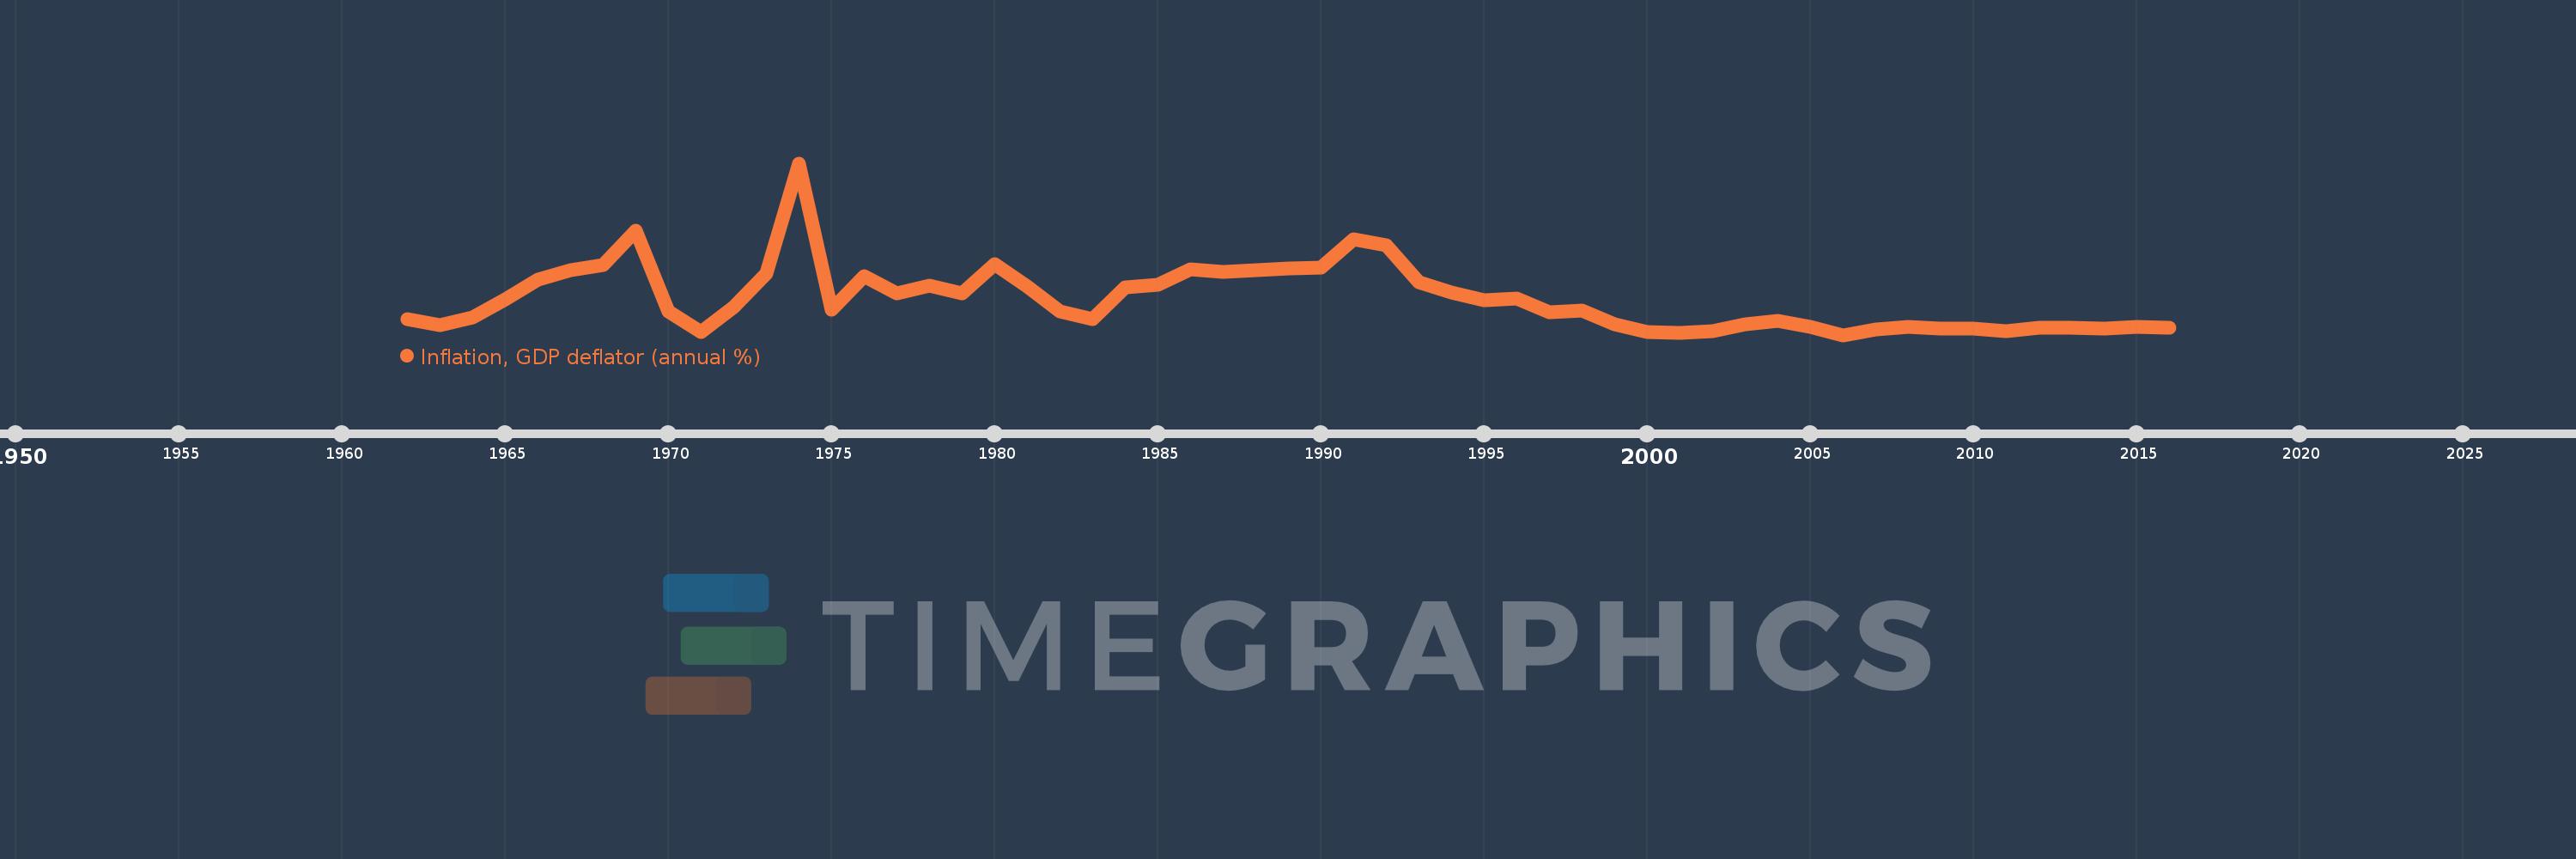
Inflation, GDP deflator (annual %)
2016,2015,2014,2013,2012,2011,2010,2009,2008,2007,2006,2005,2004,2003,2002,2001,2000,1999,1998,1997,1996,1995,1994,1993,1992,1991,1990,1989,1988,1987,1986,1985,1984,1983,1982,1981,1980,1979,1978,1977,1976,1975,1974,1973,1972,1971,1970,1969,1968,1967,1966,1965,1964,1963,1962
This statistics in other country:
AfghanistanAlbaniaAlgeriaAndorraAngolaAntigua and BarbudaArab WorldArgentinaArmeniaArubaAustraliaAustriaAzerbaijanBahamas, TheBahrainBangladeshBarbadosBelarusBelgiumBelizeBeninBermudaBhutanBoliviaBosnia and HerzegovinaBotswanaBrazilBrunei DarussalamBulgariaBurkina FasoBurundiCabo VerdeCambodiaCameroonCanadaCaribbean small statesCayman IslandsCentral African RepublicCentral Europe and the BalticsChadChannel IslandsChileChinaColombiaComorosCongo, Dem. Rep.Congo, Rep.Costa RicaCote d'IvoireCroatiaCubaCyprusCzech RepublicDenmarkDjiboutiDominicaDominican RepublicEarly-demographic dividendEast Asia & PacificEast Asia & Pacific (excluding high income)East Asia & Pacific (IDA & IBRD countries)EcuadorEgypt, Arab Rep.El SalvadorEquatorial GuineaEritreaEstoniaEthiopiaEuro areaEurope & Central AsiaEurope & Central Asia (excluding high income)Europe & Central Asia (IDA & IBRD countries)European UnionFijiFinlandFragile and conflict affected situationsFranceFrench PolynesiaGabonGambia, TheGeorgiaGermanyGhanaGreeceGreenlandGrenadaGuatemalaGuineaGuinea-BissauGuyanaHaitiHeavily indebted poor countries (HIPC)High incomeHondurasHong Kong SAR, ChinaHungaryIBRD onlyIcelandIDA & IBRD totalIDA blendIDA onlyIDA totalIndiaIndonesiaIran, Islamic Rep.IraqIrelandIsle of ManIsraelItalyJamaicaJapanJordanKazakhstanKenyaKiribatiKorea, Rep.KosovoKuwaitKyrgyz RepublicLao PDRLate-demographic dividendLatin America & Caribbean Latin America & Caribbean (excluding high income)Latin America & the Caribbean (IDA & IBRD countries)LatviaLeast developed countries: UN classificationLebanonLesothoLiberiaLibyaLiechtensteinLithuaniaLow & middle incomeLow incomeLower middle incomeLuxembourgMacao SAR, ChinaMacedonia, FYRMadagascarMalawiMalaysiaMaldivesMaliMaltaMarshall IslandsMauritaniaMauritiusMexicoMicronesia, Fed. Sts.Middle East & North AfricaMiddle East & North Africa (excluding high income)Middle East & North Africa (IDA & IBRD countries)Middle incomeMoldovaMonacoMongoliaMontenegroMoroccoMozambiqueMyanmarNamibiaNauruNepalNetherlandsNew CaledoniaNew ZealandNicaraguaNigerNigeriaNorth AmericaNorwayOECD membersOmanOther small statesPacific island small statesPakistanPalauPanamaPapua New GuineaParaguayPeruPhilippinesPolandPortugalPost-demographic dividendPre-demographic dividendPuerto RicoQatarRomaniaRussian FederationRwandaSamoaSan MarinoSao Tome and PrincipeSaudi ArabiaSenegalSerbiaSeychellesSierra LeoneSingaporeSlovak RepublicSloveniaSmall statesSolomon IslandsSomaliaSouth AfricaSouth AsiaSouth Asia (IDA & IBRD)South SudanSpainSri LankaSt. Kitts and NevisSt. LuciaSt. Vincent and the GrenadinesSub-Saharan Africa Sub-Saharan Africa (excluding high income)Sub-Saharan Africa (IDA & IBRD countries)SudanSurinameSwazilandSwedenSwitzerlandSyrian Arab RepublicTajikistanTanzaniaThailandTimor-LesteTogoTongaTrinidad and TobagoTunisiaTurkeyTurkmenistanTuvaluUgandaUkraineUnited Arab EmiratesUnited KingdomUnited StatesUpper middle incomeUruguayUzbekistanVanuatuVenezuela, RBVietnamVirgin Islands (U.S.)West Bank and GazaWorldYemen, Rep.ZambiaZimbabwe Timeline:
This timeline shows a graph from 1962 to 2016 of Uruguay. No data until 1961. Number of actual observations by date: 55.
Source name:
World Development Indicators
Source organization:
World Bank national accounts data, and OECD National Accounts data files.
Categories, topics:
Economy & Growth
Last updated:
apr 23, 2017
Indicators value changes by year
Maximum:
191.574
jan 1, 1974
At the date of observation
Value
Absolute change
Change from previous value
jan 1, 1962
18.427
+18.427
0.0%
jan 1, 1963
11.991
-6.436
-34.93%
jan 1, 1964
19.899
+7.908
65.95%
jan 1, 1965
40.352
+20.453
102.78%
jan 1, 1966
62.185
+21.833
54.11%
jan 1, 1967
72.318
+10.133
16.29%
jan 1, 1968
78.528
+6.211
8.59%
jan 1, 1969
116.249
+37.721
48.03%
jan 1, 1970
27.08
-89.169
-76.71%
jan 1, 1971
4.187
-22.893
-84.54%
jan 1, 1972
31.69
+27.502
656.78%
jan 1, 1973
69.167
+37.477
118.26%
jan 1, 1974
191.574
+122.407
176.97%
jan 1, 1975
28.487
-163.087
-85.13%
jan 1, 1976
65.978
+37.491
131.61%
jan 1, 1977
47.291
-18.686
-28.32%
jan 1, 1978
55.607
+8.315
17.58%
jan 1, 1979
46.802
-8.805
-15.83%
jan 1, 1980
79.208
+32.407
69.24%
jan 1, 1981
54.763
-24.445
-30.86%
jan 1, 1982
27.345
-27.418
-50.07%
jan 1, 1983
18.162
-9.182
-33.58%
jan 1, 1984
53.731
+35.569
195.84%
jan 1, 1985
56.35
+2.619
4.87%
jan 1, 1986
74.017
+17.668
31.35%
jan 1, 1987
70.963
-3.054
-4.13%
jan 1, 1988
72.784
+1.821
2.57%
jan 1, 1989
74.636
+1.852
2.55%
jan 1, 1990
76.079
+1.443
1.93%
jan 1, 1991
106.837
+30.757
40.43%
jan 1, 1992
100.808
-6.029
-5.64%
jan 1, 1993
59.624
-41.185
-40.85%
jan 1, 1994
47.852
-11.772
-19.74%
jan 1, 1995
38.957
-8.895
-18.59%
jan 1, 1996
41.048
+2.091
5.37%
jan 1, 1997
26.432
-14.617
-35.61%
jan 1, 1998
27.485
+1.053
3.99%
jan 1, 1999
12.384
-15.101
-54.94%
jan 1, 2000
4.326
-8.058
-65.07%
jan 1, 2001
3.539
-0.787
-18.19%
jan 1, 2002
4.827
+1.287
36.37%
jan 1, 2003
12.616
+7.79
161.39%
jan 1, 2004
16.542
+3.925
31.11%
jan 1, 2005
10.105
-6.437
-38.91%
jan 1, 2006
0.678
-9.427
-93.29%
jan 1, 2007
6.533
+5.855
863.81%
jan 1, 2008
9.417
+2.884
44.14%
jan 1, 2009
8.024
-1.394
-14.8%
jan 1, 2010
7.748
-0.276
-3.44%
jan 1, 2011
4.907
-2.841
-36.66%
jan 1, 2012
9.01
+4.103
83.61%
jan 1, 2013
8.558
-0.452
-5.02%
jan 1, 2014
8.154
-0.404
-4.72%
jan 1, 2015
9.372
+1.219
14.94%
jan 1, 2016
8.698
-0.674
-7.2%
Ranking of countries by current statistics by years


Comments: