29
/
en
AIzaSyAYiBZKx7MnpbEhh9jyipgxe19OcubqV5w
April 1, 2024
73118
Australia
AUS
true
2
1
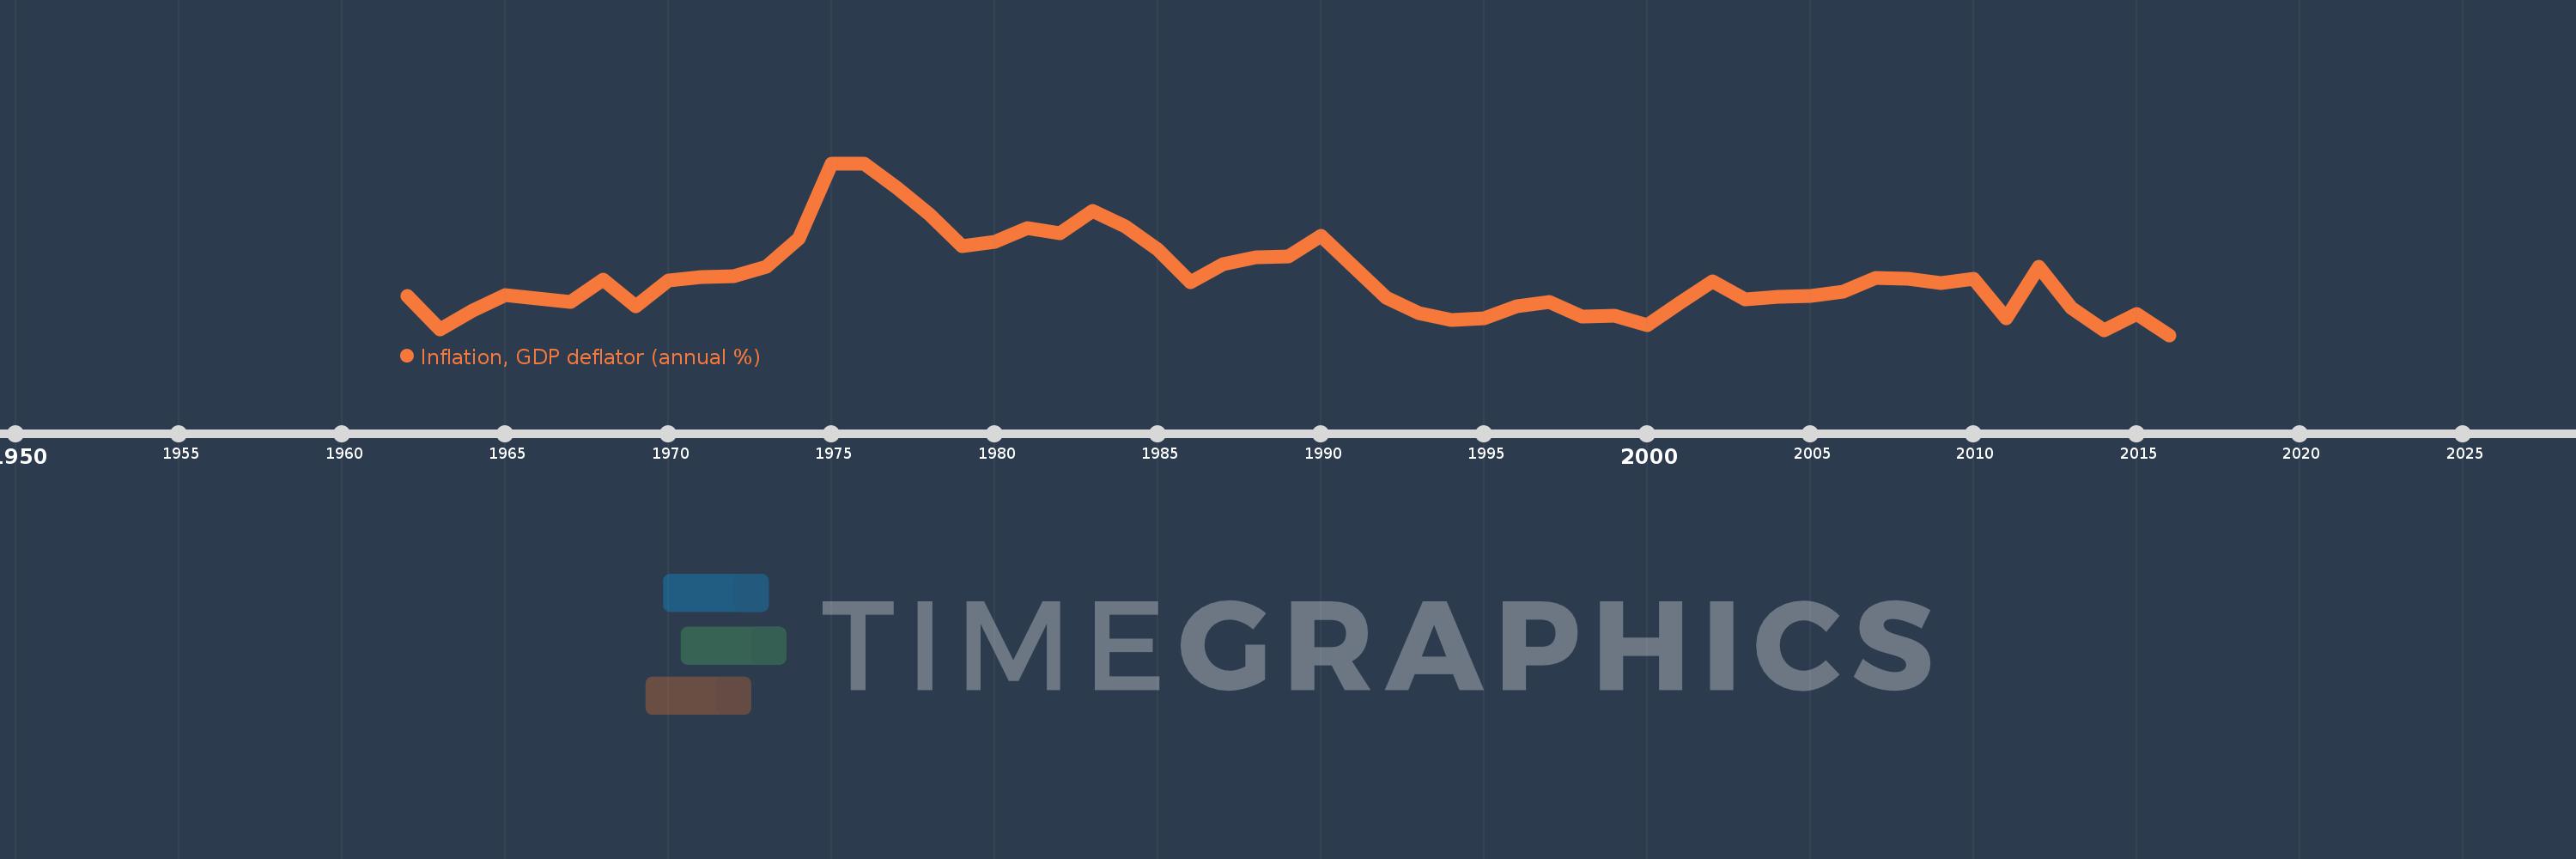
Inflation, GDP deflator (annual %)
2016,2015,2014,2013,2012,2011,2010,2009,2008,2007,2006,2005,2004,2003,2002,2001,2000,1999,1998,1997,1996,1995,1994,1993,1992,1991,1990,1989,1988,1987,1986,1985,1984,1983,1982,1981,1980,1979,1978,1977,1976,1975,1974,1973,1972,1971,1970,1969,1968,1967,1966,1965,1964,1963,1962
This statistics in other country:
AfghanistanAlbaniaAlgeriaAndorraAngolaAntigua and BarbudaArab WorldArgentinaArmeniaArubaAustraliaAustriaAzerbaijanBahamas, TheBahrainBangladeshBarbadosBelarusBelgiumBelizeBeninBermudaBhutanBoliviaBosnia and HerzegovinaBotswanaBrazilBrunei DarussalamBulgariaBurkina FasoBurundiCabo VerdeCambodiaCameroonCanadaCaribbean small statesCayman IslandsCentral African RepublicCentral Europe and the BalticsChadChannel IslandsChileChinaColombiaComorosCongo, Dem. Rep.Congo, Rep.Costa RicaCote d'IvoireCroatiaCubaCyprusCzech RepublicDenmarkDjiboutiDominicaDominican RepublicEarly-demographic dividendEast Asia & PacificEast Asia & Pacific (excluding high income)East Asia & Pacific (IDA & IBRD countries)EcuadorEgypt, Arab Rep.El SalvadorEquatorial GuineaEritreaEstoniaEthiopiaEuro areaEurope & Central AsiaEurope & Central Asia (excluding high income)Europe & Central Asia (IDA & IBRD countries)European UnionFijiFinlandFragile and conflict affected situationsFranceFrench PolynesiaGabonGambia, TheGeorgiaGermanyGhanaGreeceGreenlandGrenadaGuatemalaGuineaGuinea-BissauGuyanaHaitiHeavily indebted poor countries (HIPC)High incomeHondurasHong Kong SAR, ChinaHungaryIBRD onlyIcelandIDA & IBRD totalIDA blendIDA onlyIDA totalIndiaIndonesiaIran, Islamic Rep.IraqIrelandIsle of ManIsraelItalyJamaicaJapanJordanKazakhstanKenyaKiribatiKorea, Rep.KosovoKuwaitKyrgyz RepublicLao PDRLate-demographic dividendLatin America & Caribbean Latin America & Caribbean (excluding high income)Latin America & the Caribbean (IDA & IBRD countries)LatviaLeast developed countries: UN classificationLebanonLesothoLiberiaLibyaLiechtensteinLithuaniaLow & middle incomeLow incomeLower middle incomeLuxembourgMacao SAR, ChinaMacedonia, FYRMadagascarMalawiMalaysiaMaldivesMaliMaltaMarshall IslandsMauritaniaMauritiusMexicoMicronesia, Fed. Sts.Middle East & North AfricaMiddle East & North Africa (excluding high income)Middle East & North Africa (IDA & IBRD countries)Middle incomeMoldovaMonacoMongoliaMontenegroMoroccoMozambiqueMyanmarNamibiaNauruNepalNetherlandsNew CaledoniaNew ZealandNicaraguaNigerNigeriaNorth AmericaNorwayOECD membersOmanOther small statesPacific island small statesPakistanPalauPanamaPapua New GuineaParaguayPeruPhilippinesPolandPortugalPost-demographic dividendPre-demographic dividendPuerto RicoQatarRomaniaRussian FederationRwandaSamoaSan MarinoSao Tome and PrincipeSaudi ArabiaSenegalSerbiaSeychellesSierra LeoneSingaporeSlovak RepublicSloveniaSmall statesSolomon IslandsSomaliaSouth AfricaSouth AsiaSouth Asia (IDA & IBRD)South SudanSpainSri LankaSt. Kitts and NevisSt. LuciaSt. Vincent and the GrenadinesSub-Saharan Africa Sub-Saharan Africa (excluding high income)Sub-Saharan Africa (IDA & IBRD countries)SudanSurinameSwazilandSwedenSwitzerlandSyrian Arab RepublicTajikistanTanzaniaThailandTimor-LesteTogoTongaTrinidad and TobagoTunisiaTurkeyTurkmenistanTuvaluUgandaUkraineUnited Arab EmiratesUnited KingdomUnited StatesUpper middle incomeUruguayUzbekistanVanuatuVenezuela, RBVietnamVirgin Islands (U.S.)West Bank and GazaWorldYemen, Rep.ZambiaZimbabwe Timeline:
This timeline shows a graph from 1962 to 2016 of Australia. No data until 1961. Number of actual observations by date: 55.
Source name:
World Development Indicators
Source organization:
World Bank national accounts data, and OECD National Accounts data files.
Categories, topics:
Economy & Growth
Last updated:
apr 23, 2017
Indicators value changes by year
Minimum:
-0.652
jan 1, 2016
Maximum:
16.469
jan 1, 1976
At the date of observation
Value
Absolute change
Change from previous value
jan 1, 1962
3.217
+3.217
0.0%
jan 1, 1963
-0.083
-3.3
-102.59%
jan 1, 1964
1.793
+1.876
-2.25K%
jan 1, 1965
3.292
+1.499
83.62%
jan 1, 1966
2.983
-0.308
-9.36%
jan 1, 1967
2.682
-0.302
-10.11%
jan 1, 1968
4.875
+2.193
81.77%
jan 1, 1969
2.244
-2.631
-53.97%
jan 1, 1970
4.76
+2.517
112.18%
jan 1, 1971
5.137
+0.377
7.91%
jan 1, 1972
5.176
+0.039
0.75%
jan 1, 1973
6.183
+1.008
19.47%
jan 1, 1974
8.996
+2.813
45.5%
jan 1, 1975
16.404
+7.408
82.34%
jan 1, 1976
16.469
+0.065
0.4%
jan 1, 1977
14.007
-2.462
-14.95%
jan 1, 1978
11.415
-2.593
-18.51%
jan 1, 1979
8.228
-3.187
-27.92%
jan 1, 1980
8.633
+0.405
4.93%
jan 1, 1981
10.013
+1.38
15.99%
jan 1, 1982
9.521
-0.492
-4.91%
jan 1, 1983
11.721
+2.2
23.11%
jan 1, 1984
10.155
-1.566
-13.36%
jan 1, 1985
7.871
-2.284
-22.49%
jan 1, 1986
4.621
-3.25
-41.29%
jan 1, 1987
6.393
+1.772
38.33%
jan 1, 1988
7.068
+0.675
10.56%
jan 1, 1989
7.222
+0.154
2.18%
jan 1, 1990
9.263
+2.04
28.25%
jan 1, 1991
6.123
-3.14
-33.9%
jan 1, 1992
3.047
-3.076
-50.24%
jan 1, 1993
1.55
-1.496
-49.11%
jan 1, 1994
0.879
-0.671
-43.29%
jan 1, 1995
1.022
+0.143
16.22%
jan 1, 1996
2.236
+1.214
118.83%
jan 1, 1997
2.686
+0.45
20.12%
jan 1, 1998
1.225
-1.461
-54.41%
jan 1, 1999
1.274
+0.049
4.02%
jan 1, 2000
0.338
-0.936
-73.48%
jan 1, 2001
2.56
+2.222
657.67%
jan 1, 2002
4.714
+2.154
84.15%
jan 1, 2003
2.863
-1.851
-39.26%
jan 1, 2004
3.116
+0.253
8.84%
jan 1, 2005
3.283
+0.167
5.37%
jan 1, 2006
3.71
+0.427
13.0%
jan 1, 2007
5.067
+1.356
36.56%
jan 1, 2008
4.977
-0.089
-1.76%
jan 1, 2009
4.538
-0.44
-8.83%
jan 1, 2010
4.926
+0.388
8.56%
jan 1, 2011
1.008
-3.918
-79.54%
jan 1, 2012
6.187
+5.179
513.83%
jan 1, 2013
2.056
-4.131
-66.77%
jan 1, 2014
-0.199
-2.255
-109.7%
jan 1, 2015
1.414
+1.613
-809.04%
jan 1, 2016
-0.652
-2.065
-146.11%
Ranking of countries by current statistics by years


Comments: