29
/
en
AIzaSyAYiBZKx7MnpbEhh9jyipgxe19OcubqV5w
April 1, 2024
91429
Brazil
BRA
true
2
1
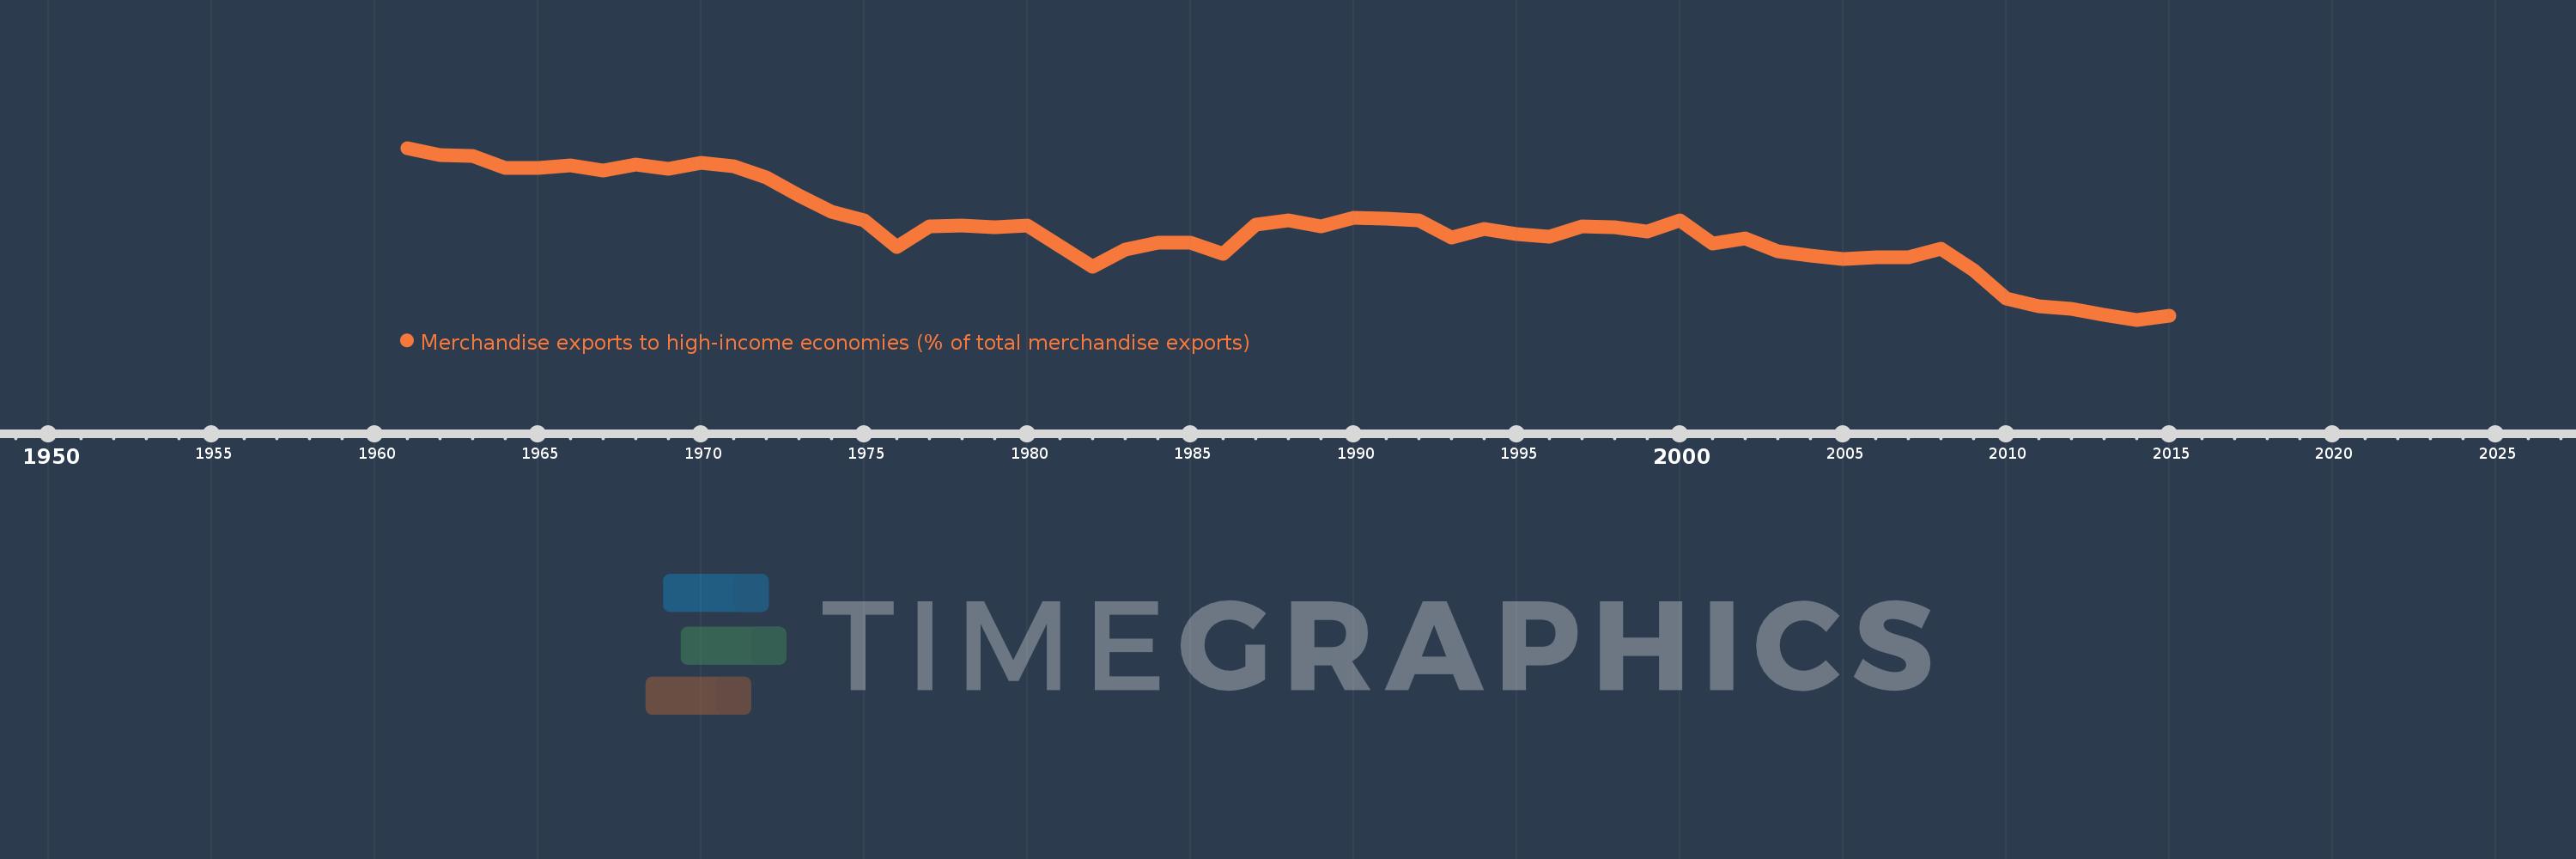
Merchandise exports to high-income economies (% of total merchandise exports)
2015,2014,2013,2012,2011,2010,2009,2008,2007,2006,2005,2004,2003,2002,2001,2000,1999,1998,1997,1996,1995,1994,1993,1992,1991,1990,1989,1988,1987,1986,1985,1984,1983,1982,1981,1980,1979,1978,1977,1976,1975,1974,1973,1972,1971,1970,1969,1968,1967,1966,1965,1964,1963,1962,1961
This statistics in other country:
AfghanistanAlbaniaAlgeriaAmerican SamoaAngolaAntigua and BarbudaArab WorldArgentinaArmeniaArubaAustraliaAustriaAzerbaijanBahamas, TheBahrainBangladeshBarbadosBelarusBelgiumBelizeBeninBermudaBoliviaBosnia and HerzegovinaBrazilBrunei DarussalamBulgariaBurkina FasoBurundiCabo VerdeCambodiaCameroonCanadaCaribbean small statesCentral African RepublicCentral Europe and the BalticsChadChileChinaColombiaComorosCongo, Dem. Rep.Congo, Rep.Costa RicaCote d'IvoireCroatiaCubaCyprusCzech RepublicDenmarkDjiboutiDominicaDominican RepublicEarly-demographic dividendEast Asia & PacificEast Asia & Pacific (excluding high income)East Asia & Pacific (IDA & IBRD countries)EcuadorEgypt, Arab Rep.El SalvadorEquatorial GuineaEstoniaEthiopiaEuro areaEurope & Central AsiaEurope & Central Asia (excluding high income)Europe & Central Asia (IDA & IBRD countries)European UnionFaroe IslandsFijiFinlandFragile and conflict affected situationsFranceFrench PolynesiaGabonGambia, TheGeorgiaGermanyGhanaGibraltarGreeceGreenlandGrenadaGuamGuatemalaGuineaGuinea-BissauGuyanaHaitiHeavily indebted poor countries (HIPC)High incomeHondurasHong Kong SAR, ChinaHungaryIBRD onlyIcelandIDA & IBRD totalIDA blendIDA onlyIDA totalIndiaIndonesiaIran, Islamic Rep.IraqIrelandIsraelItalyJamaicaJapanJordanKazakhstanKenyaKiribatiKorea, Dem. People’s Rep.Korea, Rep.KosovoKuwaitKyrgyz RepublicLao PDRLate-demographic dividendLatin America & Caribbean Latin America & Caribbean (excluding high income)Latin America & the Caribbean (IDA & IBRD countries)LatviaLeast developed countries: UN classificationLebanonLiberiaLibyaLithuaniaLow & middle incomeLow incomeLower middle incomeLuxembourgMacao SAR, ChinaMacedonia, FYRMadagascarMalawiMalaysiaMaldivesMaliMaltaMauritaniaMauritiusMexicoMiddle East & North AfricaMiddle East & North Africa (excluding high income)Middle East & North Africa (IDA & IBRD countries)Middle incomeMoldovaMongoliaMontenegroMoroccoMozambiqueMyanmarNauruNepalNetherlandsNew CaledoniaNew ZealandNicaraguaNigerNigeriaNorth AmericaNorwayOECD membersOmanOther small statesPacific island small statesPakistanPanamaPapua New GuineaParaguayPeruPhilippinesPolandPortugalPost-demographic dividendPre-demographic dividendQatarRomaniaRussian FederationRwandaSamoaSao Tome and PrincipeSaudi ArabiaSenegalSerbiaSeychellesSierra LeoneSingaporeSlovak RepublicSloveniaSmall statesSolomon IslandsSomaliaSouth AfricaSouth AsiaSouth Asia (IDA & IBRD)SpainSri LankaSt. Kitts and NevisSt. LuciaSt. Vincent and the GrenadinesSub-Saharan Africa Sub-Saharan Africa (excluding high income)Sub-Saharan Africa (IDA & IBRD countries)SudanSurinameSwedenSwitzerlandSyrian Arab RepublicTajikistanTanzaniaThailandTogoTongaTrinidad and TobagoTunisiaTurkeyTurkmenistanTuvaluUgandaUkraineUnited Arab EmiratesUnited KingdomUnited StatesUpper middle incomeUruguayUzbekistanVanuatuVenezuela, RBVietnamWorldYemen, Rep.ZambiaZimbabwe Timeline:
This timeline shows a graph from 1961 to 2015 of Brazil. No data until 1960. Number of actual observations by date: 55.
Source name:
World Development Indicators
Source organization:
World Bank staff estimates based data from International Monetary Fund's Direction of Trade database.
Categories, topics:
Private Sector, Trade
Last updated:
apr 23, 2017
Indicators value changes by year
Minimum:
58.569
jan 1, 2014
Maximum:
91.117
jan 1, 1961
At the date of observation
Value
Absolute change
Change from previous value
jan 1, 1961
91.117
+91.117
0.0%
jan 1, 1962
89.84
-1.278
-1.4%
jan 1, 1963
89.609
-0.231
-0.26%
jan 1, 1964
87.32
-2.289
-2.55%
jan 1, 1965
87.288
-0.032
-0.04%
jan 1, 1966
87.783
+0.495
0.57%
jan 1, 1967
86.812
-0.971
-1.11%
jan 1, 1968
87.991
+1.179
1.36%
jan 1, 1969
87.112
-0.879
-1.0%
jan 1, 1970
88.255
+1.143
1.31%
jan 1, 1971
87.572
-0.683
-0.77%
jan 1, 1972
85.548
-2.024
-2.31%
jan 1, 1973
82.188
-3.36
-3.93%
jan 1, 1974
79.046
-3.142
-3.82%
jan 1, 1975
77.428
-1.618
-2.05%
jan 1, 1976
72.412
-5.016
-6.48%
jan 1, 1977
76.273
+3.861
5.33%
jan 1, 1978
76.35
+0.077
0.1%
jan 1, 1979
76.115
-0.235
-0.31%
jan 1, 1980
76.451
+0.336
0.44%
jan 1, 1981
72.549
-3.902
-5.1%
jan 1, 1982
68.591
-3.958
-5.46%
jan 1, 1983
71.843
+3.252
4.74%
jan 1, 1984
73.157
+1.313
1.83%
jan 1, 1985
73.099
-0.057
-0.08%
jan 1, 1986
71.093
-2.007
-2.75%
jan 1, 1987
76.538
+5.446
7.66%
jan 1, 1988
77.402
+0.864
1.13%
jan 1, 1989
76.178
-1.224
-1.58%
jan 1, 1990
77.823
+1.645
2.16%
jan 1, 1991
77.724
-0.099
-0.13%
jan 1, 1992
77.419
-0.305
-0.39%
jan 1, 1993
74.103
-3.316
-4.28%
jan 1, 1994
75.806
+1.703
2.3%
jan 1, 1995
74.858
-0.947
-1.25%
jan 1, 1996
74.382
-0.477
-0.64%
jan 1, 1997
76.22
+1.839
2.47%
jan 1, 1998
76.074
-0.147
-0.19%
jan 1, 1999
75.312
-0.762
-1.0%
jan 1, 2000
77.37
+2.058
2.73%
jan 1, 2001
72.958
-4.412
-5.7%
jan 1, 2002
74.028
+1.069
1.47%
jan 1, 2003
71.549
-2.479
-3.35%
jan 1, 2004
70.728
-0.821
-1.15%
jan 1, 2005
70.003
-0.725
-1.03%
jan 1, 2006
70.337
+0.334
0.48%
jan 1, 2007
70.379
+0.042
0.06%
jan 1, 2008
72.048
+1.668
2.37%
jan 1, 2009
67.939
-4.108
-5.7%
jan 1, 2010
62.511
-5.428
-7.99%
jan 1, 2011
61.045
-1.466
-2.35%
jan 1, 2012
60.659
-0.386
-0.63%
jan 1, 2013
59.447
-1.212
-2.0%
jan 1, 2014
58.569
-0.878
-1.48%
jan 1, 2015
59.346
+0.777
1.33%
Ranking of countries by current statistics by years


Comments: