29
/
en
AIzaSyAYiBZKx7MnpbEhh9jyipgxe19OcubqV5w
April 1, 2024
33628
European Union
EUU
false
2
1
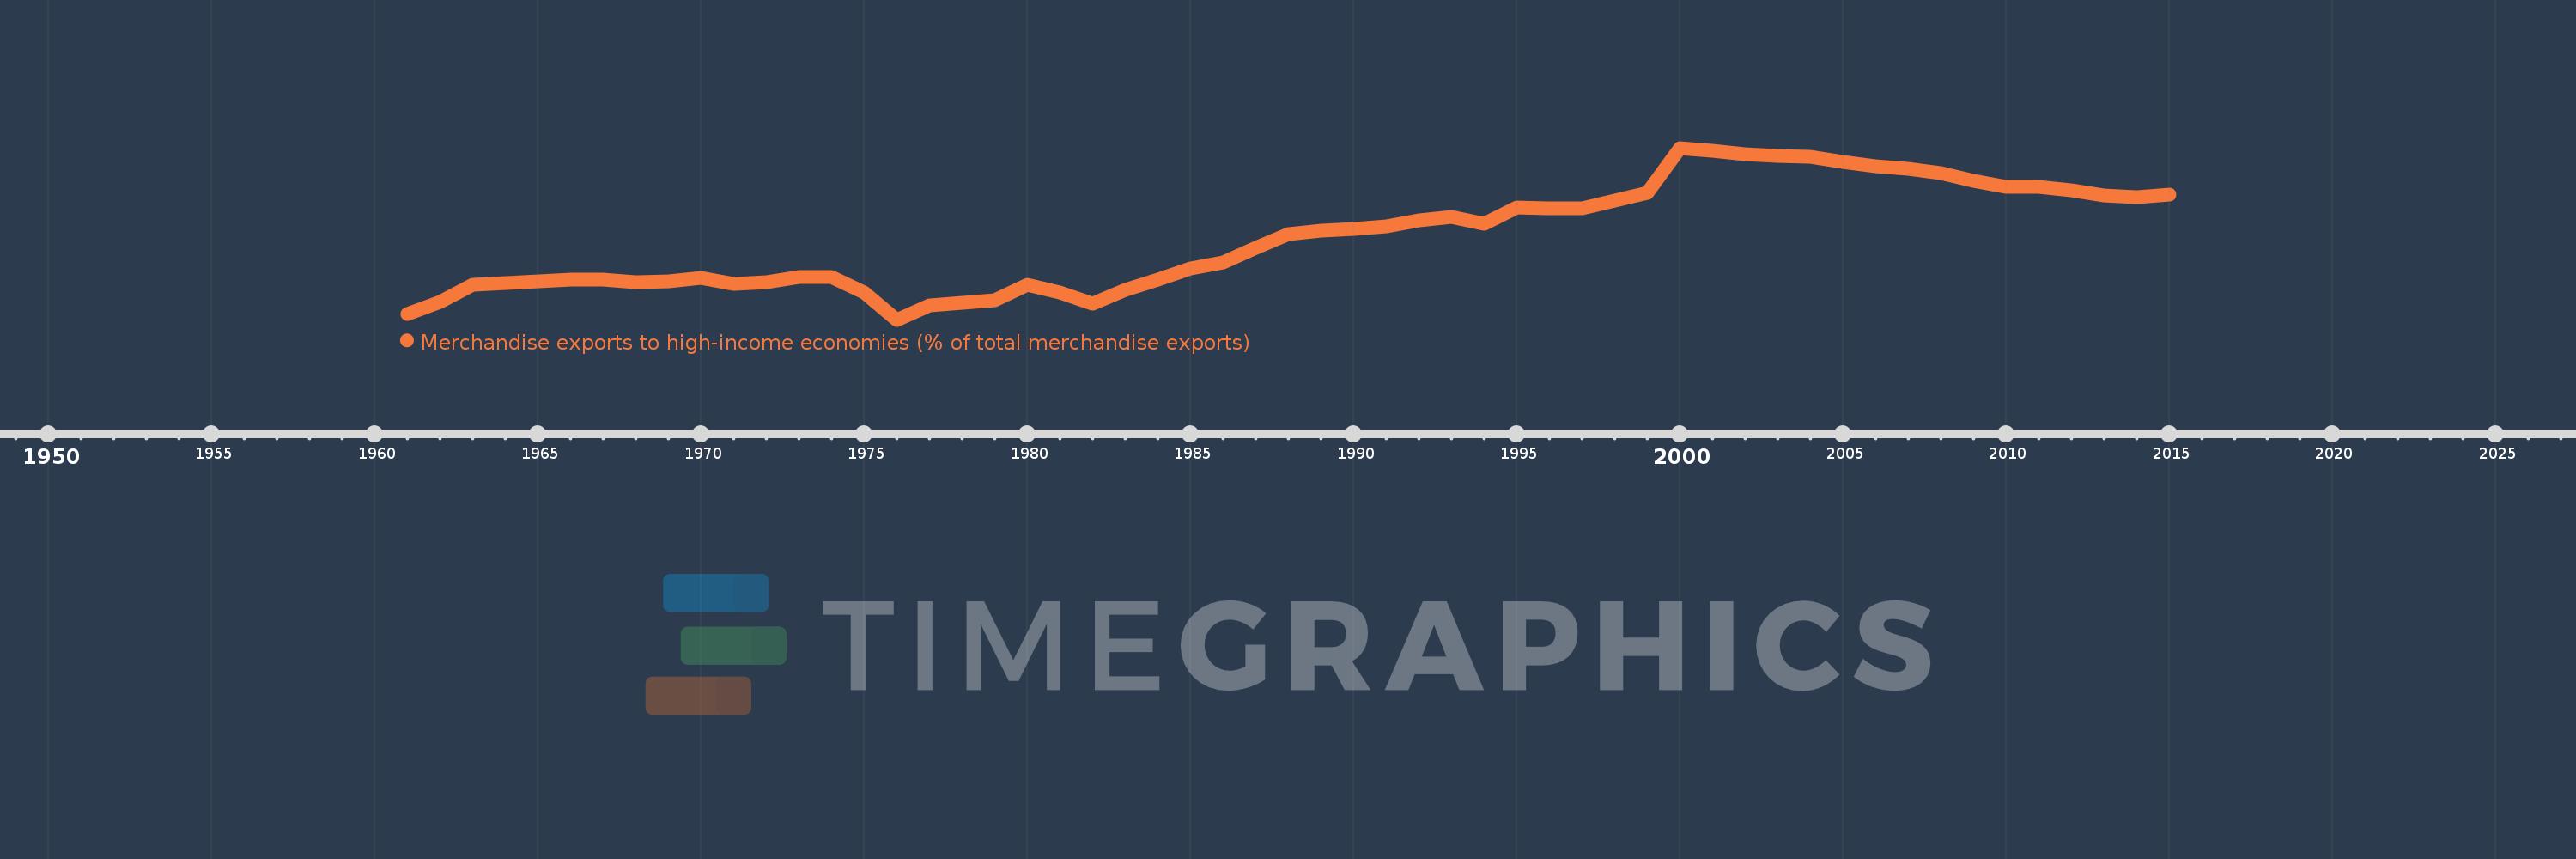
Merchandise exports to high-income economies (% of total merchandise exports)
2015,2014,2013,2012,2011,2010,2009,2008,2007,2006,2005,2004,2003,2002,2001,2000,1999,1998,1997,1996,1995,1994,1993,1992,1991,1990,1989,1988,1987,1986,1985,1984,1983,1982,1981,1980,1979,1978,1977,1976,1975,1974,1973,1972,1971,1970,1969,1968,1967,1966,1965,1964,1963,1962,1961
This statistics in other country:
AfghanistanAlbaniaAlgeriaAmerican SamoaAngolaAntigua and BarbudaArab WorldArgentinaArmeniaArubaAustraliaAustriaAzerbaijanBahamas, TheBahrainBangladeshBarbadosBelarusBelgiumBelizeBeninBermudaBoliviaBosnia and HerzegovinaBrazilBrunei DarussalamBulgariaBurkina FasoBurundiCabo VerdeCambodiaCameroonCanadaCaribbean small statesCentral African RepublicCentral Europe and the BalticsChadChileChinaColombiaComorosCongo, Dem. Rep.Congo, Rep.Costa RicaCote d'IvoireCroatiaCubaCyprusCzech RepublicDenmarkDjiboutiDominicaDominican RepublicEarly-demographic dividendEast Asia & PacificEast Asia & Pacific (excluding high income)East Asia & Pacific (IDA & IBRD countries)EcuadorEgypt, Arab Rep.El SalvadorEquatorial GuineaEstoniaEthiopiaEuro areaEurope & Central AsiaEurope & Central Asia (excluding high income)Europe & Central Asia (IDA & IBRD countries)European UnionFaroe IslandsFijiFinlandFragile and conflict affected situationsFranceFrench PolynesiaGabonGambia, TheGeorgiaGermanyGhanaGibraltarGreeceGreenlandGrenadaGuamGuatemalaGuineaGuinea-BissauGuyanaHaitiHeavily indebted poor countries (HIPC)High incomeHondurasHong Kong SAR, ChinaHungaryIBRD onlyIcelandIDA & IBRD totalIDA blendIDA onlyIDA totalIndiaIndonesiaIran, Islamic Rep.IraqIrelandIsraelItalyJamaicaJapanJordanKazakhstanKenyaKiribatiKorea, Dem. People’s Rep.Korea, Rep.KosovoKuwaitKyrgyz RepublicLao PDRLate-demographic dividendLatin America & Caribbean Latin America & Caribbean (excluding high income)Latin America & the Caribbean (IDA & IBRD countries)LatviaLeast developed countries: UN classificationLebanonLiberiaLibyaLithuaniaLow & middle incomeLow incomeLower middle incomeLuxembourgMacao SAR, ChinaMacedonia, FYRMadagascarMalawiMalaysiaMaldivesMaliMaltaMauritaniaMauritiusMexicoMiddle East & North AfricaMiddle East & North Africa (excluding high income)Middle East & North Africa (IDA & IBRD countries)Middle incomeMoldovaMongoliaMontenegroMoroccoMozambiqueMyanmarNauruNepalNetherlandsNew CaledoniaNew ZealandNicaraguaNigerNigeriaNorth AmericaNorwayOECD membersOmanOther small statesPacific island small statesPakistanPanamaPapua New GuineaParaguayPeruPhilippinesPolandPortugalPost-demographic dividendPre-demographic dividendQatarRomaniaRussian FederationRwandaSamoaSao Tome and PrincipeSaudi ArabiaSenegalSerbiaSeychellesSierra LeoneSingaporeSlovak RepublicSloveniaSmall statesSolomon IslandsSomaliaSouth AfricaSouth AsiaSouth Asia (IDA & IBRD)SpainSri LankaSt. Kitts and NevisSt. LuciaSt. Vincent and the GrenadinesSub-Saharan Africa Sub-Saharan Africa (excluding high income)Sub-Saharan Africa (IDA & IBRD countries)SudanSurinameSwedenSwitzerlandSyrian Arab RepublicTajikistanTanzaniaThailandTogoTongaTrinidad and TobagoTunisiaTurkeyTurkmenistanTuvaluUgandaUkraineUnited Arab EmiratesUnited KingdomUnited StatesUpper middle incomeUruguayUzbekistanVanuatuVenezuela, RBVietnamWorldYemen, Rep.ZambiaZimbabwe Timeline:
This timeline shows a graph from 1961 to 2015 of European Union. No data until 1960. Number of actual observations by date: 55.
Source name:
World Development Indicators
Source organization:
World Bank staff estimates based data from International Monetary Fund's Direction of Trade database.
Categories, topics:
Private Sector, Trade
Last updated:
apr 23, 2017
Indicators value changes by year
Minimum:
67.623
jan 1, 1976
Maximum:
89.828
jan 1, 2000
At the date of observation
Value
Absolute change
Change from previous value
jan 1, 1961
68.347
+68.347
0.0%
jan 1, 1962
69.93
+1.582
2.32%
jan 1, 1963
72.125
+2.195
3.14%
jan 1, 1964
72.379
+0.254
0.35%
jan 1, 1965
72.638
+0.258
0.36%
jan 1, 1966
72.767
+0.129
0.18%
jan 1, 1967
72.819
+0.052
0.07%
jan 1, 1968
72.462
-0.357
-0.49%
jan 1, 1969
72.577
+0.115
0.16%
jan 1, 1970
73.018
+0.441
0.61%
jan 1, 1971
72.274
-0.744
-1.02%
jan 1, 1972
72.512
+0.238
0.33%
jan 1, 1973
73.13
+0.617
0.85%
jan 1, 1974
73.166
+0.036
0.05%
jan 1, 1975
71.191
-1.974
-2.7%
jan 1, 1976
67.623
-3.568
-5.01%
jan 1, 1977
69.449
+1.826
2.7%
jan 1, 1978
69.779
+0.331
0.48%
jan 1, 1979
70.107
+0.328
0.47%
jan 1, 1980
72.182
+2.075
2.96%
jan 1, 1981
71.116
-1.066
-1.48%
jan 1, 1982
69.682
-1.433
-2.02%
jan 1, 1983
71.477
+1.794
2.58%
jan 1, 1984
72.788
+1.311
1.83%
jan 1, 1985
74.291
+1.503
2.06%
jan 1, 1986
74.976
+0.685
0.92%
jan 1, 1987
76.888
+1.912
2.55%
jan 1, 1988
78.703
+1.816
2.36%
jan 1, 1989
79.091
+0.388
0.49%
jan 1, 1990
79.408
+0.318
0.4%
jan 1, 1991
79.671
+0.263
0.33%
jan 1, 1992
80.426
+0.755
0.95%
jan 1, 1993
80.883
+0.457
0.57%
jan 1, 1994
80.069
-0.815
-1.01%
jan 1, 1995
82.091
+2.022
2.53%
jan 1, 1996
82.042
-0.049
-0.06%
jan 1, 1997
82.005
-0.037
-0.04%
jan 1, 1998
83.052
+1.046
1.28%
jan 1, 1999
84.04
+0.988
1.19%
jan 1, 2000
89.828
+5.788
6.89%
jan 1, 2001
89.472
-0.356
-0.4%
jan 1, 2002
89.059
-0.413
-0.46%
jan 1, 2003
88.796
-0.263
-0.3%
jan 1, 2004
88.676
-0.12
-0.14%
jan 1, 2005
87.987
-0.689
-0.78%
jan 1, 2006
87.485
-0.502
-0.57%
jan 1, 2007
87.177
-0.308
-0.35%
jan 1, 2008
86.556
-0.621
-0.71%
jan 1, 2009
85.581
-0.974
-1.13%
jan 1, 2010
84.827
-0.755
-0.88%
jan 1, 2011
84.747
-0.08
-0.09%
jan 1, 2012
84.365
-0.382
-0.45%
jan 1, 2013
83.644
-0.721
-0.85%
jan 1, 2014
83.5
-0.144
-0.17%
jan 1, 2015
83.849
+0.349
0.42%
Ranking of countries by current statistics by years


Comments: