29
/
en
AIzaSyAYiBZKx7MnpbEhh9jyipgxe19OcubqV5w
April 1, 2024
228765
Romania
ROU
true
2
1
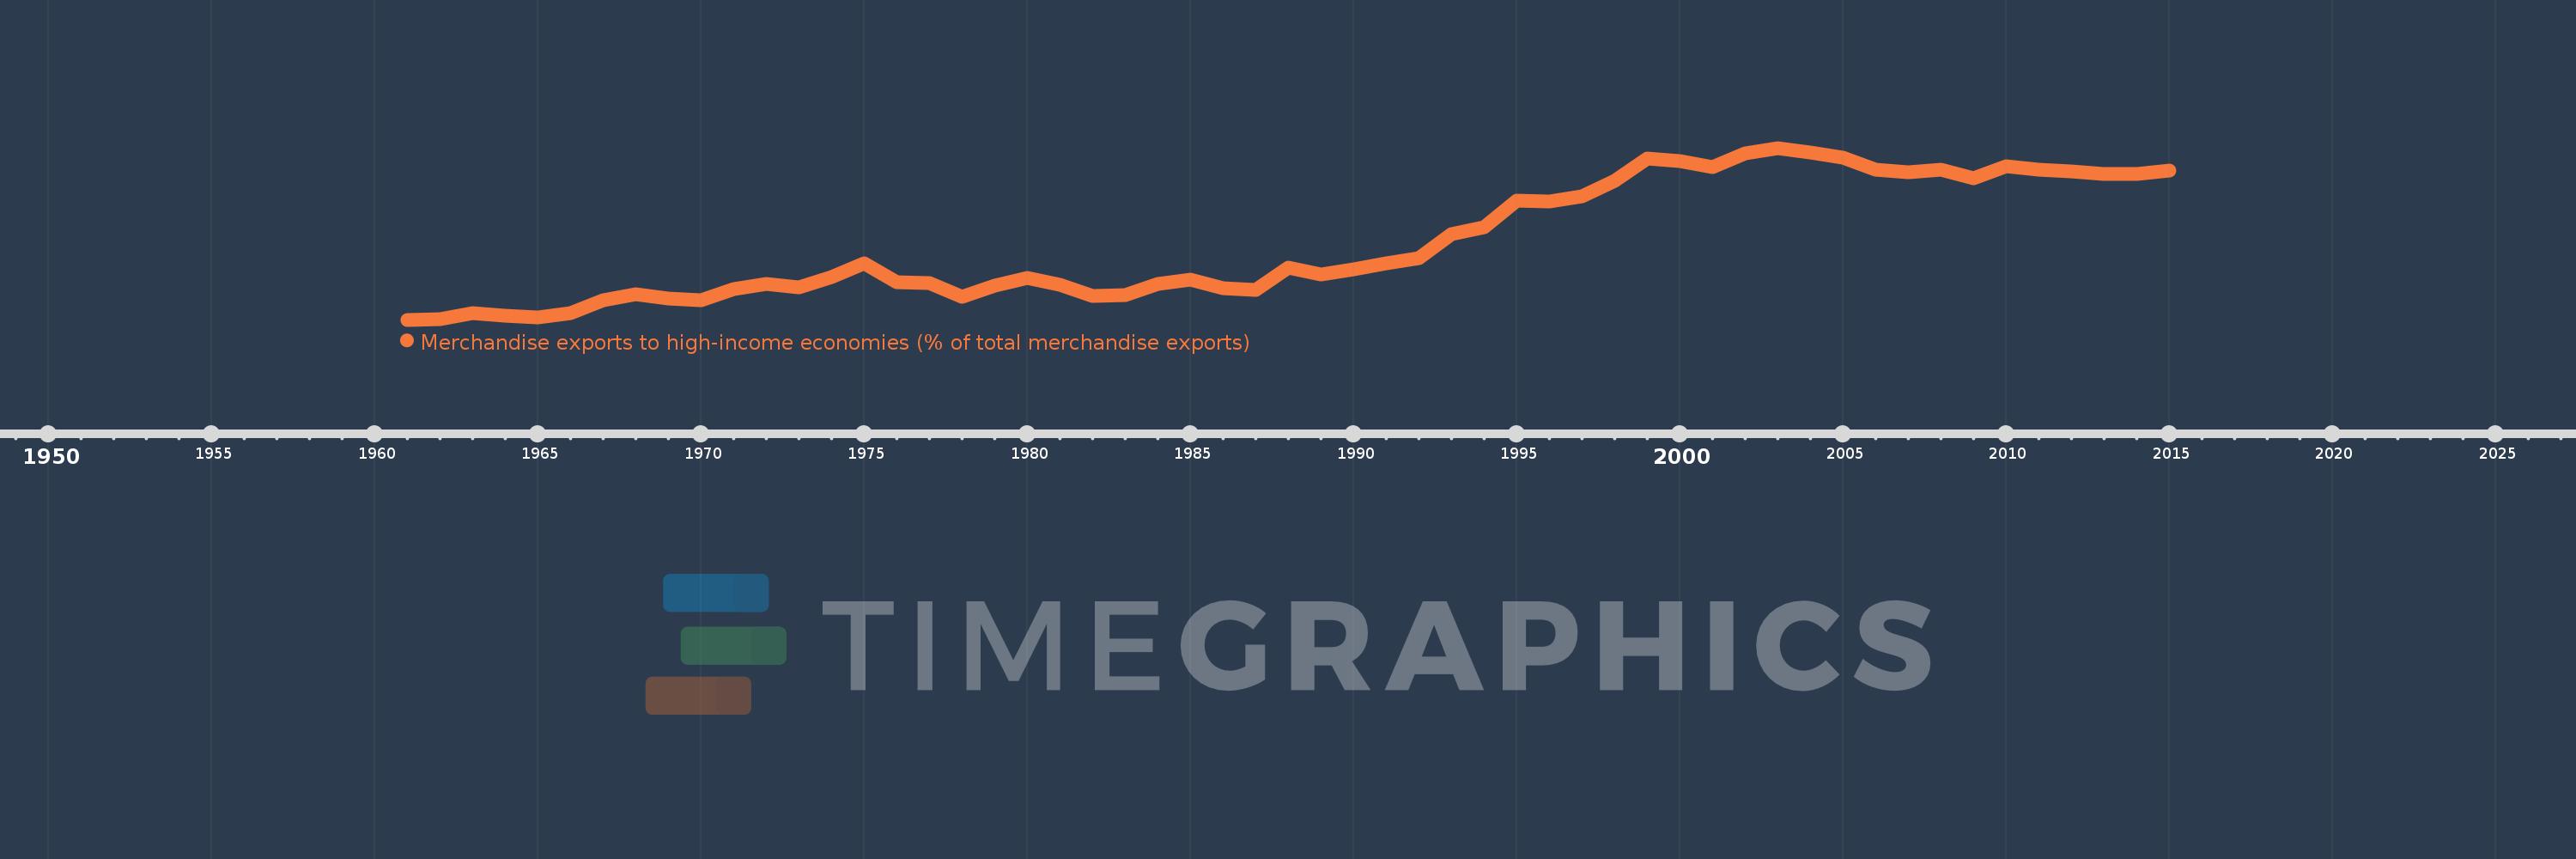
Merchandise exports to high-income economies (% of total merchandise exports)
2015,2014,2013,2012,2011,2010,2009,2008,2007,2006,2005,2004,2003,2002,2001,2000,1999,1998,1997,1996,1995,1994,1993,1992,1991,1990,1989,1988,1987,1986,1985,1984,1983,1982,1981,1980,1979,1978,1977,1976,1975,1974,1973,1972,1971,1970,1969,1968,1967,1966,1965,1964,1963,1962,1961
This statistics in other country:
AfghanistanAlbaniaAlgeriaAmerican SamoaAngolaAntigua and BarbudaArab WorldArgentinaArmeniaArubaAustraliaAustriaAzerbaijanBahamas, TheBahrainBangladeshBarbadosBelarusBelgiumBelizeBeninBermudaBoliviaBosnia and HerzegovinaBrazilBrunei DarussalamBulgariaBurkina FasoBurundiCabo VerdeCambodiaCameroonCanadaCaribbean small statesCentral African RepublicCentral Europe and the BalticsChadChileChinaColombiaComorosCongo, Dem. Rep.Congo, Rep.Costa RicaCote d'IvoireCroatiaCubaCyprusCzech RepublicDenmarkDjiboutiDominicaDominican RepublicEarly-demographic dividendEast Asia & PacificEast Asia & Pacific (excluding high income)East Asia & Pacific (IDA & IBRD countries)EcuadorEgypt, Arab Rep.El SalvadorEquatorial GuineaEstoniaEthiopiaEuro areaEurope & Central AsiaEurope & Central Asia (excluding high income)Europe & Central Asia (IDA & IBRD countries)European UnionFaroe IslandsFijiFinlandFragile and conflict affected situationsFranceFrench PolynesiaGabonGambia, TheGeorgiaGermanyGhanaGibraltarGreeceGreenlandGrenadaGuamGuatemalaGuineaGuinea-BissauGuyanaHaitiHeavily indebted poor countries (HIPC)High incomeHondurasHong Kong SAR, ChinaHungaryIBRD onlyIcelandIDA & IBRD totalIDA blendIDA onlyIDA totalIndiaIndonesiaIran, Islamic Rep.IraqIrelandIsraelItalyJamaicaJapanJordanKazakhstanKenyaKiribatiKorea, Dem. People’s Rep.Korea, Rep.KosovoKuwaitKyrgyz RepublicLao PDRLate-demographic dividendLatin America & Caribbean Latin America & Caribbean (excluding high income)Latin America & the Caribbean (IDA & IBRD countries)LatviaLeast developed countries: UN classificationLebanonLiberiaLibyaLithuaniaLow & middle incomeLow incomeLower middle incomeLuxembourgMacao SAR, ChinaMacedonia, FYRMadagascarMalawiMalaysiaMaldivesMaliMaltaMauritaniaMauritiusMexicoMiddle East & North AfricaMiddle East & North Africa (excluding high income)Middle East & North Africa (IDA & IBRD countries)Middle incomeMoldovaMongoliaMontenegroMoroccoMozambiqueMyanmarNauruNepalNetherlandsNew CaledoniaNew ZealandNicaraguaNigerNigeriaNorth AmericaNorwayOECD membersOmanOther small statesPacific island small statesPakistanPanamaPapua New GuineaParaguayPeruPhilippinesPolandPortugalPost-demographic dividendPre-demographic dividendQatarRomaniaRussian FederationRwandaSamoaSao Tome and PrincipeSaudi ArabiaSenegalSerbiaSeychellesSierra LeoneSingaporeSlovak RepublicSloveniaSmall statesSolomon IslandsSomaliaSouth AfricaSouth AsiaSouth Asia (IDA & IBRD)SpainSri LankaSt. Kitts and NevisSt. LuciaSt. Vincent and the GrenadinesSub-Saharan Africa Sub-Saharan Africa (excluding high income)Sub-Saharan Africa (IDA & IBRD countries)SudanSurinameSwedenSwitzerlandSyrian Arab RepublicTajikistanTanzaniaThailandTogoTongaTrinidad and TobagoTunisiaTurkeyTurkmenistanTuvaluUgandaUkraineUnited Arab EmiratesUnited KingdomUnited StatesUpper middle incomeUruguayUzbekistanVanuatuVenezuela, RBVietnamWorldYemen, Rep.ZambiaZimbabwe Timeline:
This timeline shows a graph from 1961 to 2015 of Romania. No data until 1960. Number of actual observations by date: 55.
Source name:
World Development Indicators
Source organization:
World Bank staff estimates based data from International Monetary Fund's Direction of Trade database.
Categories, topics:
Private Sector, Trade
Last updated:
apr 23, 2017
Indicators value changes by year
Minimum:
30.262
jan 1, 1961
Maximum:
84.721
jan 1, 2003
At the date of observation
Value
Absolute change
Change from previous value
jan 1, 1961
30.262
+30.262
0.0%
jan 1, 1962
30.321
+0.059
0.19%
jan 1, 1963
32.431
+2.109
6.96%
jan 1, 1964
31.505
-0.926
-2.85%
jan 1, 1965
30.961
-0.544
-1.73%
jan 1, 1966
32.426
+1.464
4.73%
jan 1, 1967
36.428
+4.003
12.34%
jan 1, 1968
38.295
+1.867
5.12%
jan 1, 1969
37.036
-1.259
-3.29%
jan 1, 1970
36.457
-0.579
-1.56%
jan 1, 1971
39.887
+3.43
9.41%
jan 1, 1972
41.658
+1.771
4.44%
jan 1, 1973
40.591
-1.067
-2.56%
jan 1, 1974
43.887
+3.295
8.12%
jan 1, 1975
48.029
+4.142
9.44%
jan 1, 1976
42.189
-5.84
-12.16%
jan 1, 1977
41.891
-0.298
-0.71%
jan 1, 1978
37.586
-4.305
-10.28%
jan 1, 1979
41.188
+3.602
9.58%
jan 1, 1980
43.425
+2.237
5.43%
jan 1, 1981
41.216
-2.209
-5.09%
jan 1, 1982
37.82
-3.396
-8.24%
jan 1, 1983
38.034
+0.215
0.57%
jan 1, 1984
41.598
+3.564
9.37%
jan 1, 1985
43.028
+1.43
3.44%
jan 1, 1986
40.262
-2.766
-6.43%
jan 1, 1987
39.837
-0.425
-1.06%
jan 1, 1988
46.914
+7.077
17.77%
jan 1, 1989
44.504
-2.411
-5.14%
jan 1, 1990
46.18
+1.677
3.77%
jan 1, 1991
48.247
+2.067
4.48%
jan 1, 1992
49.676
+1.428
2.96%
jan 1, 1993
57.486
+7.811
15.72%
jan 1, 1994
59.643
+2.157
3.75%
jan 1, 1995
67.943
+8.3
13.92%
jan 1, 1996
67.745
-0.198
-0.29%
jan 1, 1997
69.353
+1.608
2.37%
jan 1, 1998
74.352
+4.999
7.21%
jan 1, 1999
81.298
+6.946
9.34%
jan 1, 2000
80.582
-0.716
-0.88%
jan 1, 2001
78.692
-1.89
-2.35%
jan 1, 2002
83.097
+4.404
5.6%
jan 1, 2003
84.721
+1.624
1.95%
jan 1, 2004
83.353
-1.368
-1.61%
jan 1, 2005
81.656
-1.697
-2.04%
jan 1, 2006
77.943
-3.713
-4.55%
jan 1, 2007
77.151
-0.792
-1.02%
jan 1, 2008
77.876
+0.725
0.94%
jan 1, 2009
75.242
-2.635
-3.38%
jan 1, 2010
78.873
+3.631
4.83%
jan 1, 2011
77.921
-0.952
-1.21%
jan 1, 2012
77.242
-0.679
-0.87%
jan 1, 2013
76.447
-0.795
-1.03%
jan 1, 2014
76.558
+0.111
0.15%
jan 1, 2015
77.566
+1.008
1.32%
Ranking of countries by current statistics by years


Comments: