29
/
en
AIzaSyAYiBZKx7MnpbEhh9jyipgxe19OcubqV5w
April 1, 2024
59993
Sub-Saharan Africa (excluding high income)
SSA
false
2
1
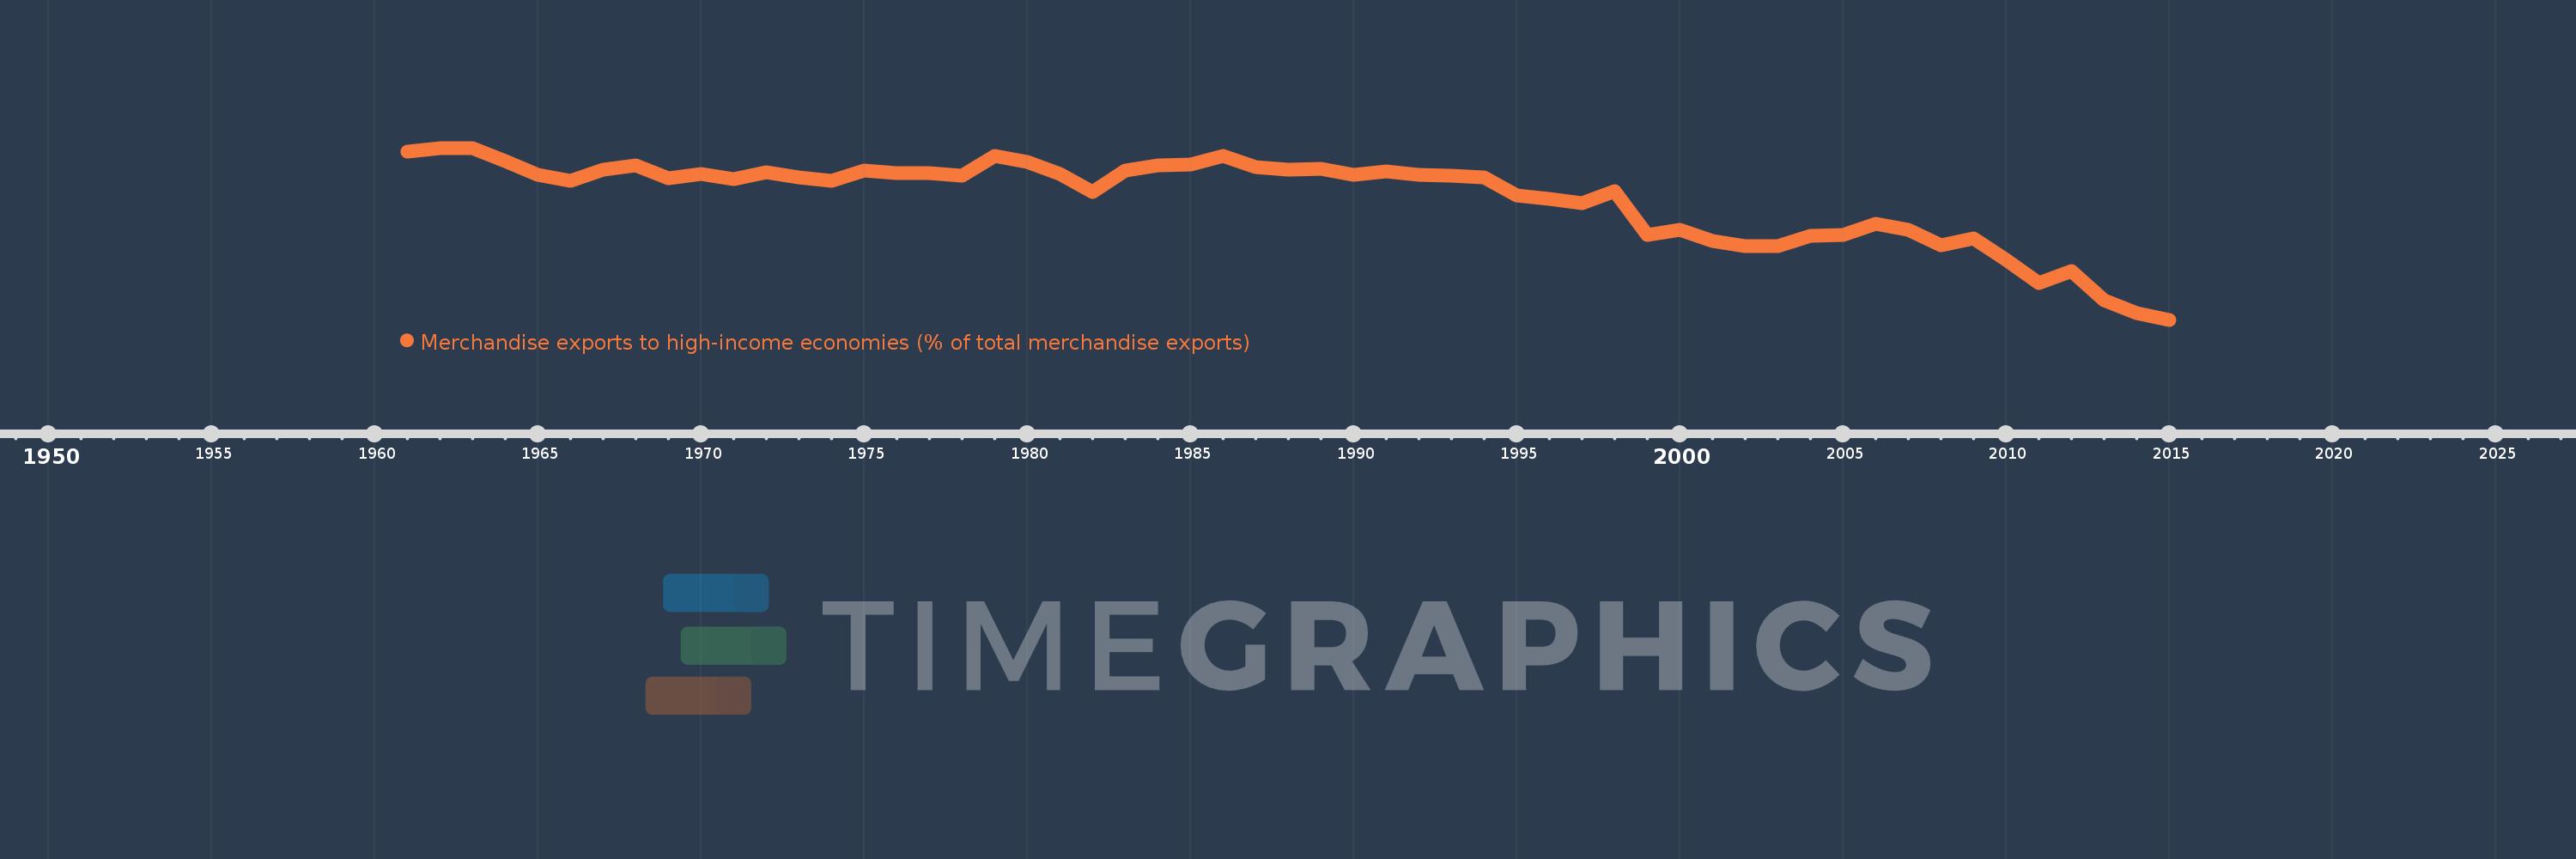
Merchandise exports to high-income economies (% of total merchandise exports)
2015,2014,2013,2012,2011,2010,2009,2008,2007,2006,2005,2004,2003,2002,2001,2000,1999,1998,1997,1996,1995,1994,1993,1992,1991,1990,1989,1988,1987,1986,1985,1984,1983,1982,1981,1980,1979,1978,1977,1976,1975,1974,1973,1972,1971,1970,1969,1968,1967,1966,1965,1964,1963,1962,1961
This statistics in other country:
AfghanistanAlbaniaAlgeriaAmerican SamoaAngolaAntigua and BarbudaArab WorldArgentinaArmeniaArubaAustraliaAustriaAzerbaijanBahamas, TheBahrainBangladeshBarbadosBelarusBelgiumBelizeBeninBermudaBoliviaBosnia and HerzegovinaBrazilBrunei DarussalamBulgariaBurkina FasoBurundiCabo VerdeCambodiaCameroonCanadaCaribbean small statesCentral African RepublicCentral Europe and the BalticsChadChileChinaColombiaComorosCongo, Dem. Rep.Congo, Rep.Costa RicaCote d'IvoireCroatiaCubaCyprusCzech RepublicDenmarkDjiboutiDominicaDominican RepublicEarly-demographic dividendEast Asia & PacificEast Asia & Pacific (excluding high income)East Asia & Pacific (IDA & IBRD countries)EcuadorEgypt, Arab Rep.El SalvadorEquatorial GuineaEstoniaEthiopiaEuro areaEurope & Central AsiaEurope & Central Asia (excluding high income)Europe & Central Asia (IDA & IBRD countries)European UnionFaroe IslandsFijiFinlandFragile and conflict affected situationsFranceFrench PolynesiaGabonGambia, TheGeorgiaGermanyGhanaGibraltarGreeceGreenlandGrenadaGuamGuatemalaGuineaGuinea-BissauGuyanaHaitiHeavily indebted poor countries (HIPC)High incomeHondurasHong Kong SAR, ChinaHungaryIBRD onlyIcelandIDA & IBRD totalIDA blendIDA onlyIDA totalIndiaIndonesiaIran, Islamic Rep.IraqIrelandIsraelItalyJamaicaJapanJordanKazakhstanKenyaKiribatiKorea, Dem. People’s Rep.Korea, Rep.KosovoKuwaitKyrgyz RepublicLao PDRLate-demographic dividendLatin America & Caribbean Latin America & Caribbean (excluding high income)Latin America & the Caribbean (IDA & IBRD countries)LatviaLeast developed countries: UN classificationLebanonLiberiaLibyaLithuaniaLow & middle incomeLow incomeLower middle incomeLuxembourgMacao SAR, ChinaMacedonia, FYRMadagascarMalawiMalaysiaMaldivesMaliMaltaMauritaniaMauritiusMexicoMiddle East & North AfricaMiddle East & North Africa (excluding high income)Middle East & North Africa (IDA & IBRD countries)Middle incomeMoldovaMongoliaMontenegroMoroccoMozambiqueMyanmarNauruNepalNetherlandsNew CaledoniaNew ZealandNicaraguaNigerNigeriaNorth AmericaNorwayOECD membersOmanOther small statesPacific island small statesPakistanPanamaPapua New GuineaParaguayPeruPhilippinesPolandPortugalPost-demographic dividendPre-demographic dividendQatarRomaniaRussian FederationRwandaSamoaSao Tome and PrincipeSaudi ArabiaSenegalSerbiaSeychellesSierra LeoneSingaporeSlovak RepublicSloveniaSmall statesSolomon IslandsSomaliaSouth AfricaSouth AsiaSouth Asia (IDA & IBRD)SpainSri LankaSt. Kitts and NevisSt. LuciaSt. Vincent and the GrenadinesSub-Saharan Africa Sub-Saharan Africa (excluding high income)Sub-Saharan Africa (IDA & IBRD countries)SudanSurinameSwedenSwitzerlandSyrian Arab RepublicTajikistanTanzaniaThailandTogoTongaTrinidad and TobagoTunisiaTurkeyTurkmenistanTuvaluUgandaUkraineUnited Arab EmiratesUnited KingdomUnited StatesUpper middle incomeUruguayUzbekistanVanuatuVenezuela, RBVietnamWorldYemen, Rep.ZambiaZimbabwe Timeline:
This timeline shows a graph from 1961 to 2015 of Sub-Saharan Africa (excluding high income). No data until 1960. Number of actual observations by date: 55.
Source name:
World Development Indicators
Source organization:
World Bank staff estimates based data from International Monetary Fund's Direction of Trade database.
Categories, topics:
Private Sector, Trade
Last updated:
apr 23, 2017
Indicators value changes by year
Minimum:
47.118
jan 1, 2015
Maximum:
84.952
jan 1, 1962
At the date of observation
Value
Absolute change
Change from previous value
jan 1, 1961
84.05
+84.05
0.0%
jan 1, 1962
84.952
+0.902
1.07%
jan 1, 1963
84.938
-0.014
-0.02%
jan 1, 1964
81.997
-2.941
-3.46%
jan 1, 1965
79.027
-2.97
-3.62%
jan 1, 1966
77.696
-1.331
-1.68%
jan 1, 1967
80.112
+2.416
3.11%
jan 1, 1968
81.125
+1.013
1.26%
jan 1, 1969
78.27
-2.855
-3.52%
jan 1, 1970
79.16
+0.889
1.14%
jan 1, 1971
78.003
-1.157
-1.46%
jan 1, 1972
79.642
+1.639
2.1%
jan 1, 1973
78.399
-1.243
-1.56%
jan 1, 1974
77.669
-0.73
-0.93%
jan 1, 1975
79.909
+2.24
2.88%
jan 1, 1976
79.455
-0.454
-0.57%
jan 1, 1977
79.334
-0.121
-0.15%
jan 1, 1978
78.888
-0.445
-0.56%
jan 1, 1979
83.198
+4.309
5.46%
jan 1, 1980
81.834
-1.364
-1.64%
jan 1, 1981
79.231
-2.602
-3.18%
jan 1, 1982
75.162
-4.069
-5.14%
jan 1, 1983
79.959
+4.797
6.38%
jan 1, 1984
81.158
+1.198
1.5%
jan 1, 1985
81.36
+0.202
0.25%
jan 1, 1986
83.147
+1.788
2.2%
jan 1, 1987
80.645
-2.502
-3.01%
jan 1, 1988
80.19
-0.456
-0.56%
jan 1, 1989
80.411
+0.221
0.28%
jan 1, 1990
78.937
-1.474
-1.83%
jan 1, 1991
79.855
+0.918
1.16%
jan 1, 1992
79.098
-0.757
-0.95%
jan 1, 1993
78.894
-0.204
-0.26%
jan 1, 1994
78.403
-0.491
-0.62%
jan 1, 1995
74.574
-3.829
-4.88%
jan 1, 1996
73.786
-0.788
-1.06%
jan 1, 1997
72.807
-0.979
-1.33%
jan 1, 1998
75.359
+2.553
3.51%
jan 1, 1999
65.699
-9.661
-12.82%
jan 1, 2000
66.946
+1.248
1.9%
jan 1, 2001
64.408
-2.538
-3.79%
jan 1, 2002
63.292
-1.117
-1.73%
jan 1, 2003
63.28
-0.012
-0.02%
jan 1, 2004
65.538
+2.258
3.57%
jan 1, 2005
65.875
+0.337
0.51%
jan 1, 2006
68.261
+2.386
3.62%
jan 1, 2007
66.957
-1.304
-1.91%
jan 1, 2008
63.551
-3.406
-5.09%
jan 1, 2009
65.105
+1.553
2.44%
jan 1, 2010
60.351
-4.753
-7.3%
jan 1, 2011
55.185
-5.167
-8.56%
jan 1, 2012
57.815
+2.63
4.77%
jan 1, 2013
51.487
-6.328
-10.95%
jan 1, 2014
48.586
-2.901
-5.63%
jan 1, 2015
47.118
-1.468
-3.02%
Ranking of countries by current statistics by years


Comments: