29
/
en
AIzaSyAYiBZKx7MnpbEhh9jyipgxe19OcubqV5w
April 1, 2024
151796
Hong Kong SAR, China
HKG
true
2
1
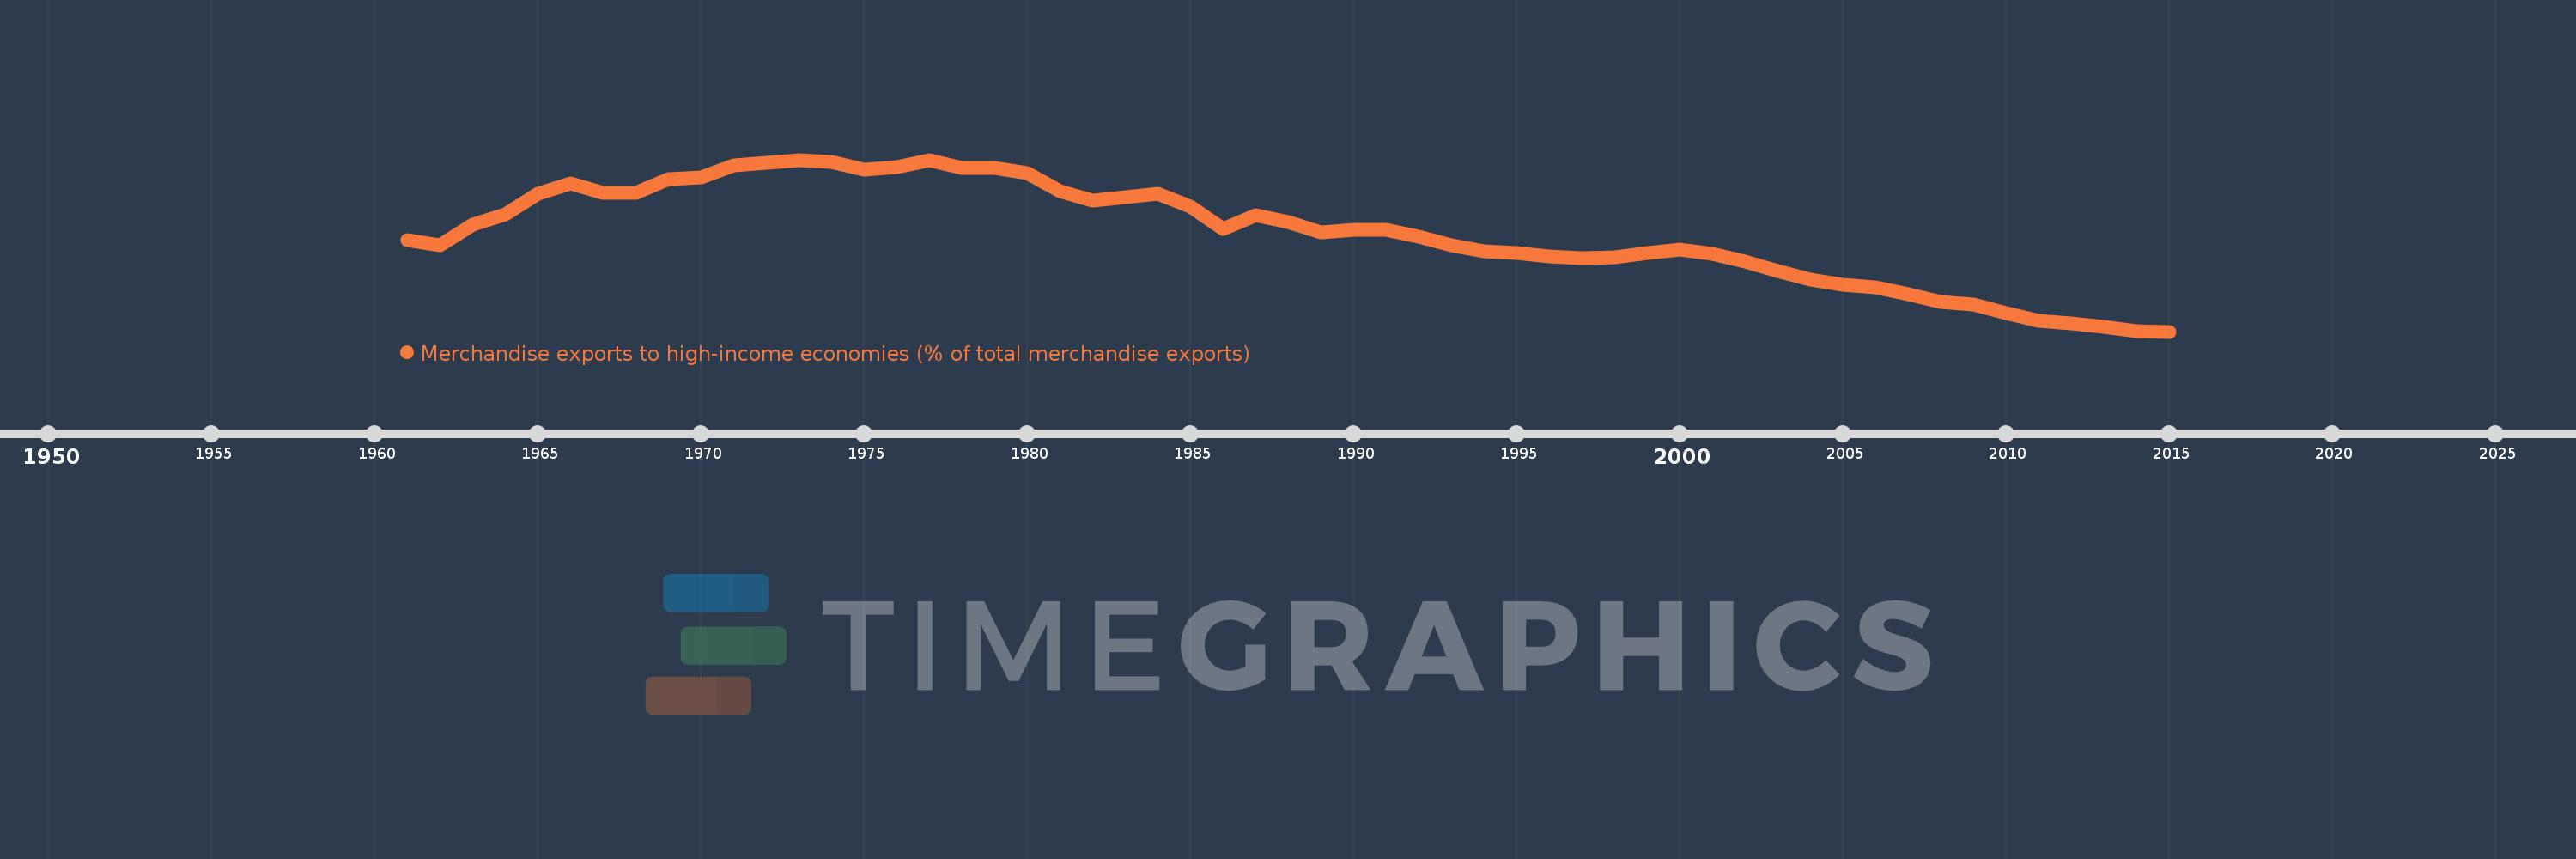
Merchandise exports to high-income economies (% of total merchandise exports)
2015,2014,2013,2012,2011,2010,2009,2008,2007,2006,2005,2004,2003,2002,2001,2000,1999,1998,1997,1996,1995,1994,1993,1992,1991,1990,1989,1988,1987,1986,1985,1984,1983,1982,1981,1980,1979,1978,1977,1976,1975,1974,1973,1972,1971,1970,1969,1968,1967,1966,1965,1964,1963,1962,1961
This statistics in other country:
AfghanistanAlbaniaAlgeriaAmerican SamoaAngolaAntigua and BarbudaArab WorldArgentinaArmeniaArubaAustraliaAustriaAzerbaijanBahamas, TheBahrainBangladeshBarbadosBelarusBelgiumBelizeBeninBermudaBoliviaBosnia and HerzegovinaBrazilBrunei DarussalamBulgariaBurkina FasoBurundiCabo VerdeCambodiaCameroonCanadaCaribbean small statesCentral African RepublicCentral Europe and the BalticsChadChileChinaColombiaComorosCongo, Dem. Rep.Congo, Rep.Costa RicaCote d'IvoireCroatiaCubaCyprusCzech RepublicDenmarkDjiboutiDominicaDominican RepublicEarly-demographic dividendEast Asia & PacificEast Asia & Pacific (excluding high income)East Asia & Pacific (IDA & IBRD countries)EcuadorEgypt, Arab Rep.El SalvadorEquatorial GuineaEstoniaEthiopiaEuro areaEurope & Central AsiaEurope & Central Asia (excluding high income)Europe & Central Asia (IDA & IBRD countries)European UnionFaroe IslandsFijiFinlandFragile and conflict affected situationsFranceFrench PolynesiaGabonGambia, TheGeorgiaGermanyGhanaGibraltarGreeceGreenlandGrenadaGuamGuatemalaGuineaGuinea-BissauGuyanaHaitiHeavily indebted poor countries (HIPC)High incomeHondurasHong Kong SAR, ChinaHungaryIBRD onlyIcelandIDA & IBRD totalIDA blendIDA onlyIDA totalIndiaIndonesiaIran, Islamic Rep.IraqIrelandIsraelItalyJamaicaJapanJordanKazakhstanKenyaKiribatiKorea, Dem. People’s Rep.Korea, Rep.KosovoKuwaitKyrgyz RepublicLao PDRLate-demographic dividendLatin America & Caribbean Latin America & Caribbean (excluding high income)Latin America & the Caribbean (IDA & IBRD countries)LatviaLeast developed countries: UN classificationLebanonLiberiaLibyaLithuaniaLow & middle incomeLow incomeLower middle incomeLuxembourgMacao SAR, ChinaMacedonia, FYRMadagascarMalawiMalaysiaMaldivesMaliMaltaMauritaniaMauritiusMexicoMiddle East & North AfricaMiddle East & North Africa (excluding high income)Middle East & North Africa (IDA & IBRD countries)Middle incomeMoldovaMongoliaMontenegroMoroccoMozambiqueMyanmarNauruNepalNetherlandsNew CaledoniaNew ZealandNicaraguaNigerNigeriaNorth AmericaNorwayOECD membersOmanOther small statesPacific island small statesPakistanPanamaPapua New GuineaParaguayPeruPhilippinesPolandPortugalPost-demographic dividendPre-demographic dividendQatarRomaniaRussian FederationRwandaSamoaSao Tome and PrincipeSaudi ArabiaSenegalSerbiaSeychellesSierra LeoneSingaporeSlovak RepublicSloveniaSmall statesSolomon IslandsSomaliaSouth AfricaSouth AsiaSouth Asia (IDA & IBRD)SpainSri LankaSt. Kitts and NevisSt. LuciaSt. Vincent and the GrenadinesSub-Saharan Africa Sub-Saharan Africa (excluding high income)Sub-Saharan Africa (IDA & IBRD countries)SudanSurinameSwedenSwitzerlandSyrian Arab RepublicTajikistanTanzaniaThailandTogoTongaTrinidad and TobagoTunisiaTurkeyTurkmenistanTuvaluUgandaUkraineUnited Arab EmiratesUnited KingdomUnited StatesUpper middle incomeUruguayUzbekistanVanuatuVenezuela, RBVietnamWorldYemen, Rep.ZambiaZimbabwe Timeline:
This timeline shows a graph from 1961 to 2015 of Hong Kong SAR, China. No data until 1960. Number of actual observations by date: 55.
Source name:
World Development Indicators
Source organization:
World Bank staff estimates based data from International Monetary Fund's Direction of Trade database.
Categories, topics:
Private Sector, Trade
Last updated:
apr 23, 2017
Indicators value changes by year
Minimum:
34.469
jan 1, 2015
Maximum:
85.295
jan 1, 1973
At the date of observation
Value
Absolute change
Change from previous value
jan 1, 1961
61.543
+61.543
0.0%
jan 1, 1962
59.892
-1.651
-2.68%
jan 1, 1963
66.216
+6.324
10.56%
jan 1, 1964
69.196
+2.98
4.5%
jan 1, 1965
75.213
+6.017
8.7%
jan 1, 1966
78.247
+3.033
4.03%
jan 1, 1967
75.532
-2.715
-3.47%
jan 1, 1968
75.53
-0.002
0.0%
jan 1, 1969
79.547
+4.016
5.32%
jan 1, 1970
80.1
+0.553
0.7%
jan 1, 1971
83.698
+3.598
4.49%
jan 1, 1972
84.418
+0.72
0.86%
jan 1, 1973
85.295
+0.877
1.04%
jan 1, 1974
84.621
-0.674
-0.79%
jan 1, 1975
82.342
-2.279
-2.69%
jan 1, 1976
83.165
+0.823
1.0%
jan 1, 1977
85.234
+2.069
2.49%
jan 1, 1978
82.993
-2.242
-2.63%
jan 1, 1979
82.98
-0.012
-0.01%
jan 1, 1980
81.378
-1.602
-1.93%
jan 1, 1981
75.967
-5.411
-6.65%
jan 1, 1982
73.344
-2.623
-3.45%
jan 1, 1983
74.244
+0.9
1.23%
jan 1, 1984
75.262
+1.018
1.37%
jan 1, 1985
71.501
-3.761
-5.0%
jan 1, 1986
64.761
-6.74
-9.43%
jan 1, 1987
68.835
+4.074
6.29%
jan 1, 1988
66.85
-1.985
-2.88%
jan 1, 1989
63.886
-2.964
-4.43%
jan 1, 1990
64.485
+0.599
0.94%
jan 1, 1991
64.599
+0.114
0.18%
jan 1, 1992
62.486
-2.113
-3.27%
jan 1, 1993
59.907
-2.578
-4.13%
jan 1, 1994
58.188
-1.719
-2.87%
jan 1, 1995
57.648
-0.54
-0.93%
jan 1, 1996
56.757
-0.89
-1.54%
jan 1, 1997
56.219
-0.538
-0.95%
jan 1, 1998
56.479
+0.26
0.46%
jan 1, 1999
57.725
+1.246
2.21%
jan 1, 2000
58.775
+1.05
1.82%
jan 1, 2001
57.435
-1.341
-2.28%
jan 1, 2002
55.246
-2.189
-3.81%
jan 1, 2003
52.388
-2.858
-5.17%
jan 1, 2004
49.76
-2.628
-5.02%
jan 1, 2005
48.41
-1.35
-2.71%
jan 1, 2006
47.643
-0.767
-1.58%
jan 1, 2007
45.521
-2.122
-4.45%
jan 1, 2008
43.112
-2.408
-5.29%
jan 1, 2009
42.387
-0.726
-1.68%
jan 1, 2010
39.91
-2.476
-5.84%
jan 1, 2011
37.554
-2.356
-5.9%
jan 1, 2012
36.906
-0.649
-1.73%
jan 1, 2013
35.771
-1.134
-3.07%
jan 1, 2014
34.659
-1.112
-3.11%
jan 1, 2015
34.469
-0.191
-0.55%
Ranking of countries by current statistics by years


Comments: