29
/
en
AIzaSyAYiBZKx7MnpbEhh9jyipgxe19OcubqV5w
April 1, 2024
165114
Jordan
JOR
true
2
1
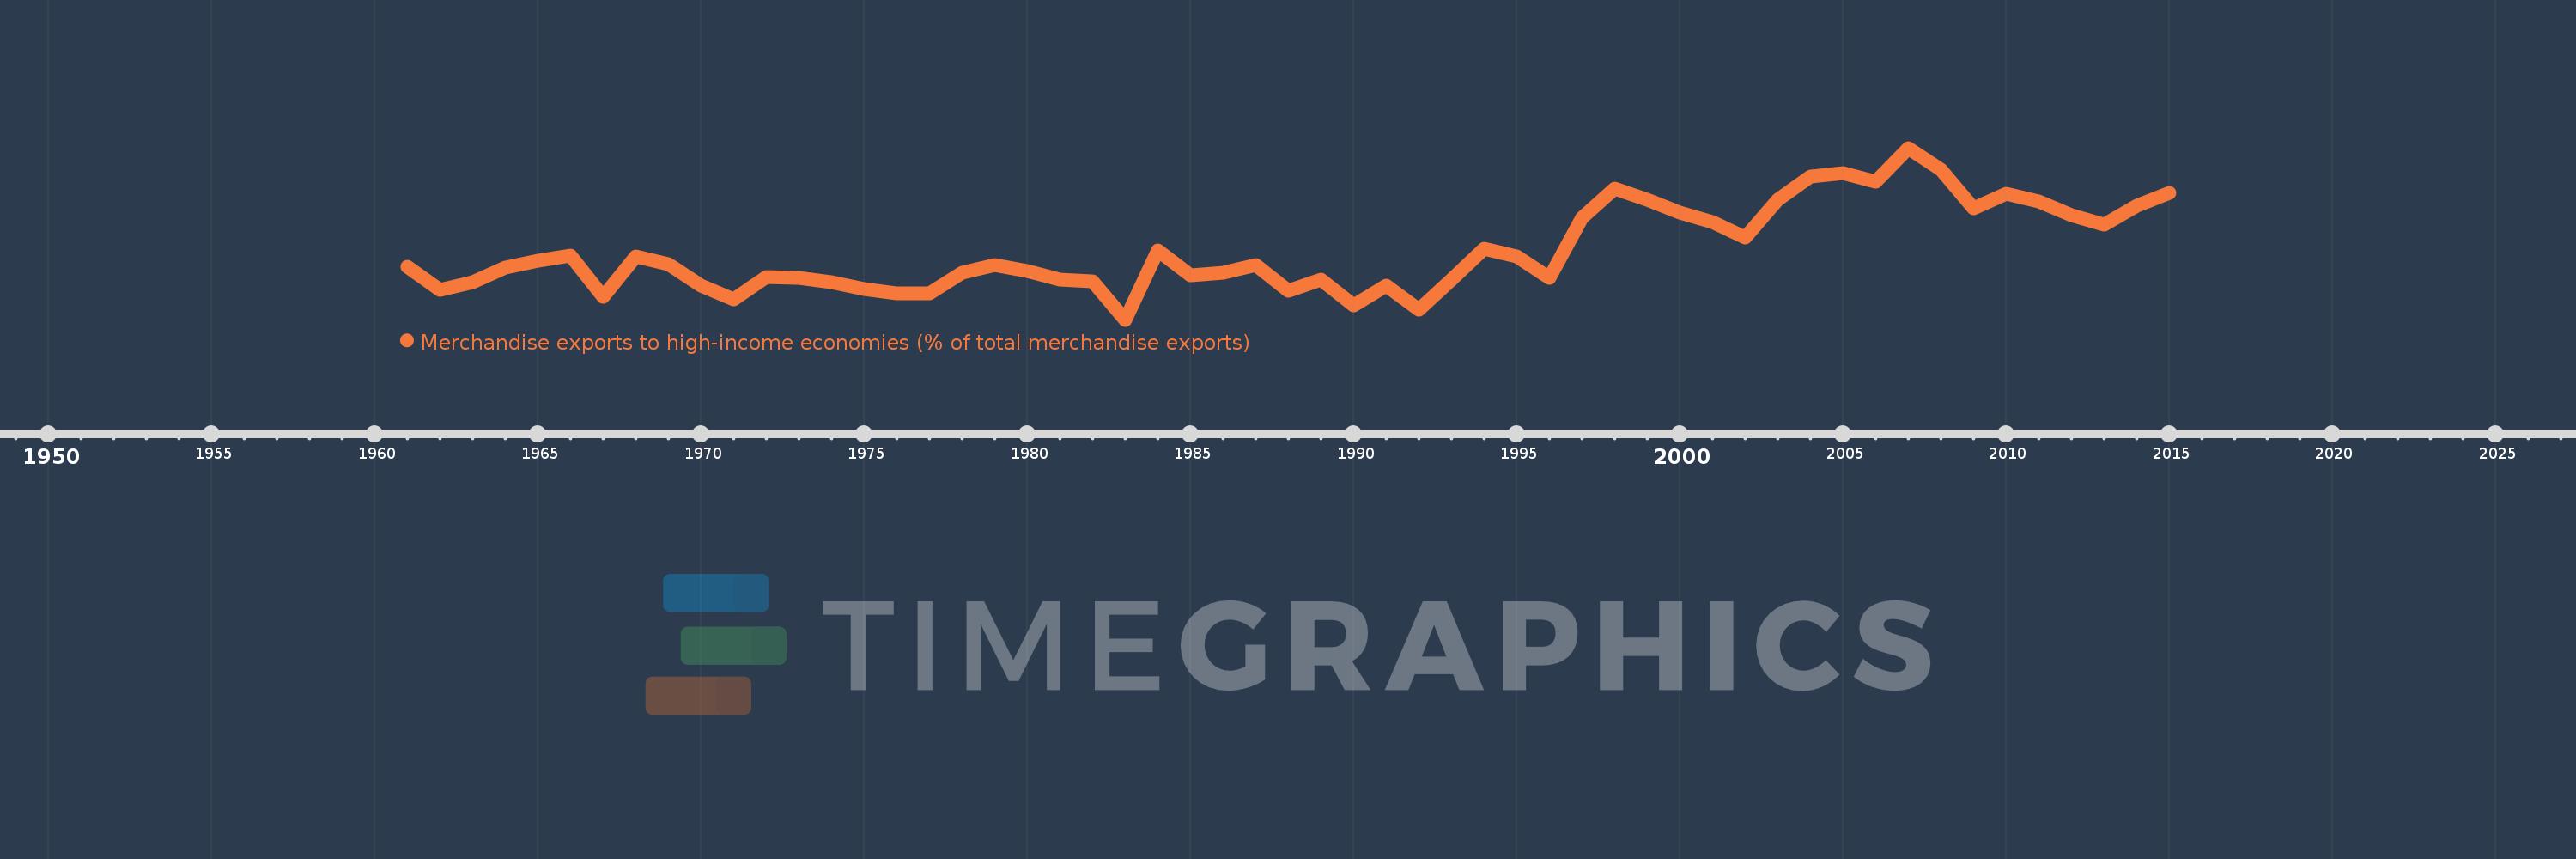
Merchandise exports to high-income economies (% of total merchandise exports)
2015,2014,2013,2012,2011,2010,2009,2008,2007,2006,2005,2004,2003,2002,2001,2000,1999,1998,1997,1996,1995,1994,1993,1992,1991,1990,1989,1988,1987,1986,1985,1984,1983,1982,1981,1980,1979,1978,1977,1976,1975,1974,1973,1972,1971,1970,1969,1968,1967,1966,1965,1964,1963,1962,1961
This statistics in other country:
AfghanistanAlbaniaAlgeriaAmerican SamoaAngolaAntigua and BarbudaArab WorldArgentinaArmeniaArubaAustraliaAustriaAzerbaijanBahamas, TheBahrainBangladeshBarbadosBelarusBelgiumBelizeBeninBermudaBoliviaBosnia and HerzegovinaBrazilBrunei DarussalamBulgariaBurkina FasoBurundiCabo VerdeCambodiaCameroonCanadaCaribbean small statesCentral African RepublicCentral Europe and the BalticsChadChileChinaColombiaComorosCongo, Dem. Rep.Congo, Rep.Costa RicaCote d'IvoireCroatiaCubaCyprusCzech RepublicDenmarkDjiboutiDominicaDominican RepublicEarly-demographic dividendEast Asia & PacificEast Asia & Pacific (excluding high income)East Asia & Pacific (IDA & IBRD countries)EcuadorEgypt, Arab Rep.El SalvadorEquatorial GuineaEstoniaEthiopiaEuro areaEurope & Central AsiaEurope & Central Asia (excluding high income)Europe & Central Asia (IDA & IBRD countries)European UnionFaroe IslandsFijiFinlandFragile and conflict affected situationsFranceFrench PolynesiaGabonGambia, TheGeorgiaGermanyGhanaGibraltarGreeceGreenlandGrenadaGuamGuatemalaGuineaGuinea-BissauGuyanaHaitiHeavily indebted poor countries (HIPC)High incomeHondurasHong Kong SAR, ChinaHungaryIBRD onlyIcelandIDA & IBRD totalIDA blendIDA onlyIDA totalIndiaIndonesiaIran, Islamic Rep.IraqIrelandIsraelItalyJamaicaJapanJordanKazakhstanKenyaKiribatiKorea, Dem. People’s Rep.Korea, Rep.KosovoKuwaitKyrgyz RepublicLao PDRLate-demographic dividendLatin America & Caribbean Latin America & Caribbean (excluding high income)Latin America & the Caribbean (IDA & IBRD countries)LatviaLeast developed countries: UN classificationLebanonLiberiaLibyaLithuaniaLow & middle incomeLow incomeLower middle incomeLuxembourgMacao SAR, ChinaMacedonia, FYRMadagascarMalawiMalaysiaMaldivesMaliMaltaMauritaniaMauritiusMexicoMiddle East & North AfricaMiddle East & North Africa (excluding high income)Middle East & North Africa (IDA & IBRD countries)Middle incomeMoldovaMongoliaMontenegroMoroccoMozambiqueMyanmarNauruNepalNetherlandsNew CaledoniaNew ZealandNicaraguaNigerNigeriaNorth AmericaNorwayOECD membersOmanOther small statesPacific island small statesPakistanPanamaPapua New GuineaParaguayPeruPhilippinesPolandPortugalPost-demographic dividendPre-demographic dividendQatarRomaniaRussian FederationRwandaSamoaSao Tome and PrincipeSaudi ArabiaSenegalSerbiaSeychellesSierra LeoneSingaporeSlovak RepublicSloveniaSmall statesSolomon IslandsSomaliaSouth AfricaSouth AsiaSouth Asia (IDA & IBRD)SpainSri LankaSt. Kitts and NevisSt. LuciaSt. Vincent and the GrenadinesSub-Saharan Africa Sub-Saharan Africa (excluding high income)Sub-Saharan Africa (IDA & IBRD countries)SudanSurinameSwedenSwitzerlandSyrian Arab RepublicTajikistanTanzaniaThailandTogoTongaTrinidad and TobagoTunisiaTurkeyTurkmenistanTuvaluUgandaUkraineUnited Arab EmiratesUnited KingdomUnited StatesUpper middle incomeUruguayUzbekistanVanuatuVenezuela, RBVietnamWorldYemen, Rep.ZambiaZimbabwe Timeline:
This timeline shows a graph from 1961 to 2015 of Jordan. No data until 1960. Number of actual observations by date: 55.
Source name:
World Development Indicators
Source organization:
World Bank staff estimates based data from International Monetary Fund's Direction of Trade database.
Categories, topics:
Private Sector, Trade
Last updated:
apr 23, 2017
Indicators value changes by year
Minimum:
18.397
jan 1, 1983
Maximum:
54.417
jan 1, 2007
At the date of observation
Value
Absolute change
Change from previous value
jan 1, 1961
29.592
+29.592
0.0%
jan 1, 1962
24.576
-5.016
-16.95%
jan 1, 1963
26.277
+1.701
6.92%
jan 1, 1964
29.412
+3.134
11.93%
jan 1, 1965
30.693
+1.281
4.36%
jan 1, 1966
31.776
+1.083
3.53%
jan 1, 1967
23.183
-8.592
-27.04%
jan 1, 1968
31.629
+8.446
36.43%
jan 1, 1969
30.0
-1.629
-5.15%
jan 1, 1970
25.589
-4.411
-14.7%
jan 1, 1971
22.711
-2.878
-11.25%
jan 1, 1972
27.341
+4.63
20.38%
jan 1, 1973
27.101
-0.24
-0.88%
jan 1, 1974
26.269
-0.832
-3.07%
jan 1, 1975
24.777
-1.492
-5.68%
jan 1, 1976
23.886
-0.891
-3.59%
jan 1, 1977
24.01
+0.124
0.52%
jan 1, 1978
28.189
+4.179
17.4%
jan 1, 1979
29.784
+1.595
5.66%
jan 1, 1980
28.591
-1.193
-4.01%
jan 1, 1981
26.842
-1.75
-6.12%
jan 1, 1982
26.437
-0.404
-1.51%
jan 1, 1983
18.397
-8.04
-30.41%
jan 1, 1984
32.979
+14.582
79.27%
jan 1, 1985
27.767
-5.212
-15.8%
jan 1, 1986
28.217
+0.45
1.62%
jan 1, 1987
29.872
+1.656
5.87%
jan 1, 1988
24.439
-5.433
-18.19%
jan 1, 1989
26.805
+2.366
9.68%
jan 1, 1990
21.421
-5.383
-20.08%
jan 1, 1991
25.517
+4.095
19.12%
jan 1, 1992
20.505
-5.012
-19.64%
jan 1, 1993
26.871
+6.366
31.04%
jan 1, 1994
33.38
+6.508
24.22%
jan 1, 1995
31.711
-1.669
-5.0%
jan 1, 1996
27.177
-4.534
-14.3%
jan 1, 1997
39.743
+12.567
46.24%
jan 1, 1998
45.916
+6.173
15.53%
jan 1, 1999
43.639
-2.277
-4.96%
jan 1, 2000
40.86
-2.779
-6.37%
jan 1, 2001
38.867
-1.993
-4.88%
jan 1, 2002
35.642
-3.224
-8.3%
jan 1, 2003
43.481
+7.838
21.99%
jan 1, 2004
48.455
+4.974
11.44%
jan 1, 2005
49.191
+0.736
1.52%
jan 1, 2006
47.325
-1.866
-3.79%
jan 1, 2007
54.417
+7.093
14.99%
jan 1, 2008
49.849
-4.568
-8.39%
jan 1, 2009
41.713
-8.136
-16.32%
jan 1, 2010
44.889
+3.176
7.61%
jan 1, 2011
43.193
-1.696
-3.78%
jan 1, 2012
40.243
-2.951
-6.83%
jan 1, 2013
38.328
-1.915
-4.76%
jan 1, 2014
42.303
+3.975
10.37%
jan 1, 2015
45.066
+2.762
6.53%
Ranking of countries by current statistics by years


Comments: