29
/
en
AIzaSyAYiBZKx7MnpbEhh9jyipgxe19OcubqV5w
April 1, 2024
213234
Nigeria
NGA
true
2
1
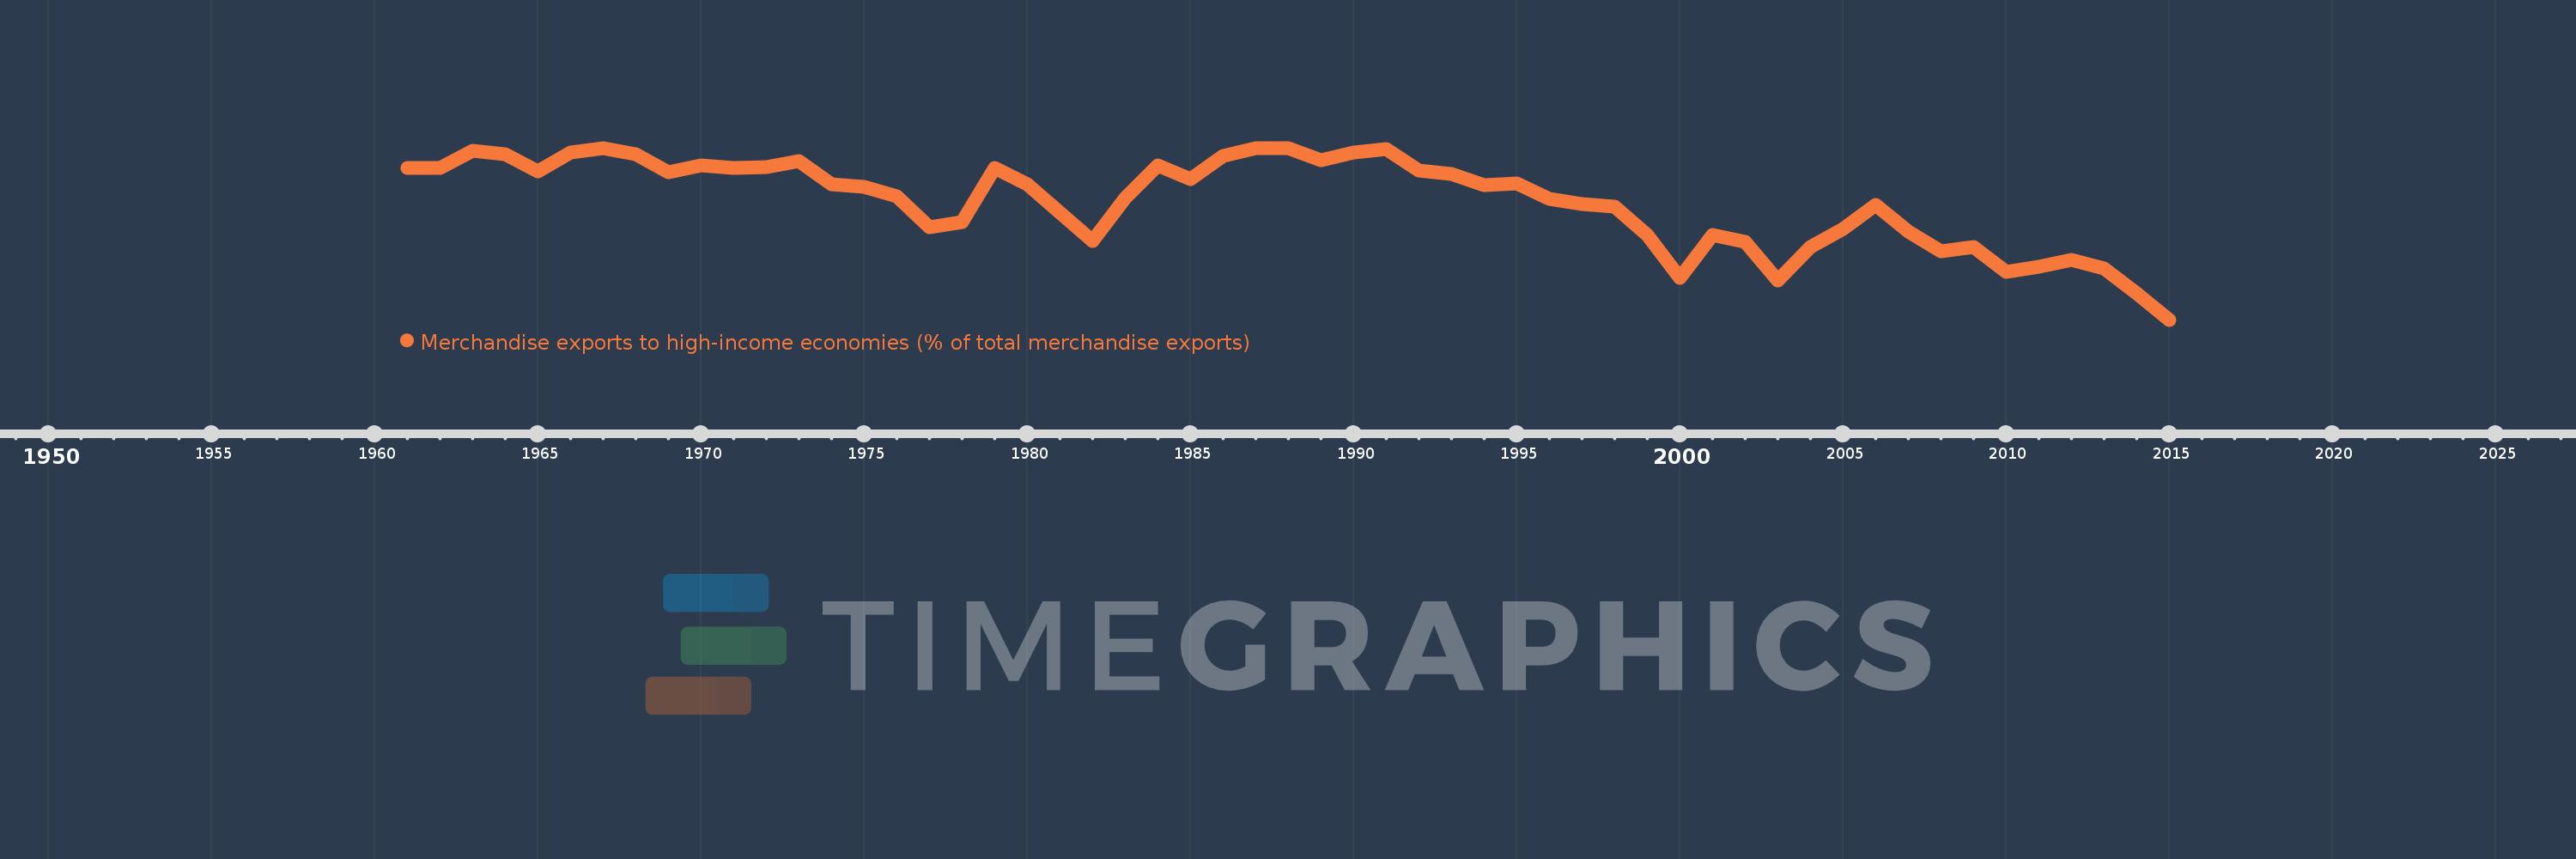
Merchandise exports to high-income economies (% of total merchandise exports)
2015,2014,2013,2012,2011,2010,2009,2008,2007,2006,2005,2004,2003,2002,2001,2000,1999,1998,1997,1996,1995,1994,1993,1992,1991,1990,1989,1988,1987,1986,1985,1984,1983,1982,1980,1979,1978,1977,1976,1975,1974,1973,1972,1971,1970,1969,1968,1967,1966,1965,1964,1963,1962,1961
This statistics in other country:
AfghanistanAlbaniaAlgeriaAmerican SamoaAngolaAntigua and BarbudaArab WorldArgentinaArmeniaArubaAustraliaAustriaAzerbaijanBahamas, TheBahrainBangladeshBarbadosBelarusBelgiumBelizeBeninBermudaBoliviaBosnia and HerzegovinaBrazilBrunei DarussalamBulgariaBurkina FasoBurundiCabo VerdeCambodiaCameroonCanadaCaribbean small statesCentral African RepublicCentral Europe and the BalticsChadChileChinaColombiaComorosCongo, Dem. Rep.Congo, Rep.Costa RicaCote d'IvoireCroatiaCubaCyprusCzech RepublicDenmarkDjiboutiDominicaDominican RepublicEarly-demographic dividendEast Asia & PacificEast Asia & Pacific (excluding high income)East Asia & Pacific (IDA & IBRD countries)EcuadorEgypt, Arab Rep.El SalvadorEquatorial GuineaEstoniaEthiopiaEuro areaEurope & Central AsiaEurope & Central Asia (excluding high income)Europe & Central Asia (IDA & IBRD countries)European UnionFaroe IslandsFijiFinlandFragile and conflict affected situationsFranceFrench PolynesiaGabonGambia, TheGeorgiaGermanyGhanaGibraltarGreeceGreenlandGrenadaGuamGuatemalaGuineaGuinea-BissauGuyanaHaitiHeavily indebted poor countries (HIPC)High incomeHondurasHong Kong SAR, ChinaHungaryIBRD onlyIcelandIDA & IBRD totalIDA blendIDA onlyIDA totalIndiaIndonesiaIran, Islamic Rep.IraqIrelandIsraelItalyJamaicaJapanJordanKazakhstanKenyaKiribatiKorea, Dem. People’s Rep.Korea, Rep.KosovoKuwaitKyrgyz RepublicLao PDRLate-demographic dividendLatin America & Caribbean Latin America & Caribbean (excluding high income)Latin America & the Caribbean (IDA & IBRD countries)LatviaLeast developed countries: UN classificationLebanonLiberiaLibyaLithuaniaLow & middle incomeLow incomeLower middle incomeLuxembourgMacao SAR, ChinaMacedonia, FYRMadagascarMalawiMalaysiaMaldivesMaliMaltaMauritaniaMauritiusMexicoMiddle East & North AfricaMiddle East & North Africa (excluding high income)Middle East & North Africa (IDA & IBRD countries)Middle incomeMoldovaMongoliaMontenegroMoroccoMozambiqueMyanmarNauruNepalNetherlandsNew CaledoniaNew ZealandNicaraguaNigerNigeriaNorth AmericaNorwayOECD membersOmanOther small statesPacific island small statesPakistanPanamaPapua New GuineaParaguayPeruPhilippinesPolandPortugalPost-demographic dividendPre-demographic dividendQatarRomaniaRussian FederationRwandaSamoaSao Tome and PrincipeSaudi ArabiaSenegalSerbiaSeychellesSierra LeoneSingaporeSlovak RepublicSloveniaSmall statesSolomon IslandsSomaliaSouth AfricaSouth AsiaSouth Asia (IDA & IBRD)SpainSri LankaSt. Kitts and NevisSt. LuciaSt. Vincent and the GrenadinesSub-Saharan Africa Sub-Saharan Africa (excluding high income)Sub-Saharan Africa (IDA & IBRD countries)SudanSurinameSwedenSwitzerlandSyrian Arab RepublicTajikistanTanzaniaThailandTogoTongaTrinidad and TobagoTunisiaTurkeyTurkmenistanTuvaluUgandaUkraineUnited Arab EmiratesUnited KingdomUnited StatesUpper middle incomeUruguayUzbekistanVanuatuVenezuela, RBVietnamWorldYemen, Rep.ZambiaZimbabwe Timeline:
This timeline shows a graph from 1961 to 2015 of Nigeria. No data until 1960. Number of actual observations by date: 54.
Source name:
World Development Indicators
Source organization:
World Bank staff estimates based data from International Monetary Fund's Direction of Trade database.
Categories, topics:
Private Sector, Trade
Last updated:
apr 23, 2017
Indicators value changes by year
Minimum:
52.451
jan 1, 2015
At the date of observation
Value
Absolute change
Change from previous value
jan 1, 1961
88.307
+88.307
0.0%
jan 1, 1962
88.352
+0.045
0.05%
jan 1, 1963
92.34
+3.989
4.51%
jan 1, 1964
91.712
-0.628
-0.68%
jan 1, 1965
87.49
-4.223
-4.6%
jan 1, 1966
91.999
+4.509
5.15%
jan 1, 1967
93.055
+1.056
1.15%
jan 1, 1968
91.604
-1.451
-1.56%
jan 1, 1969
87.418
-4.186
-4.57%
jan 1, 1970
88.896
+1.479
1.69%
jan 1, 1971
88.389
-0.508
-0.57%
jan 1, 1972
88.626
+0.237
0.27%
jan 1, 1973
89.914
+1.289
1.45%
jan 1, 1974
84.448
-5.466
-6.08%
jan 1, 1975
83.875
-0.573
-0.68%
jan 1, 1976
81.566
-2.309
-2.75%
jan 1, 1977
74.282
-7.284
-8.93%
jan 1, 1978
75.659
+1.378
1.85%
jan 1, 1979
88.355
+12.696
16.78%
jan 1, 1980
84.471
-3.885
-4.4%
jan 1, 1982
71.09
-13.381
-15.84%
jan 1, 1983
81.257
+10.167
14.3%
jan 1, 1984
88.961
+7.704
9.48%
jan 1, 1985
85.736
-3.225
-3.63%
jan 1, 1986
91.303
+5.566
6.49%
jan 1, 1987
93.11
+1.807
1.98%
jan 1, 1988
93.11
+0.0
0.0%
jan 1, 1989
90.124
-2.986
-3.21%
jan 1, 1990
92.126
+2.002
2.22%
jan 1, 1991
92.781
+0.656
0.71%
jan 1, 1992
87.734
-5.048
-5.44%
jan 1, 1993
86.982
-0.751
-0.86%
jan 1, 1994
84.261
-2.721
-3.13%
jan 1, 1995
84.79
+0.528
0.63%
jan 1, 1996
80.96
-3.829
-4.52%
jan 1, 1997
79.825
-1.136
-1.4%
jan 1, 1998
79.126
-0.698
-0.87%
jan 1, 1999
72.598
-6.529
-8.25%
jan 1, 2000
62.375
-10.222
-14.08%
jan 1, 2001
72.554
+10.179
16.32%
jan 1, 2002
70.977
-1.577
-2.17%
jan 1, 2003
61.655
-9.322
-13.13%
jan 1, 2004
69.702
+8.047
13.05%
jan 1, 2005
73.92
+4.219
6.05%
jan 1, 2006
79.551
+5.63
7.62%
jan 1, 2007
73.388
-6.163
-7.75%
jan 1, 2008
68.6
-4.788
-6.52%
jan 1, 2009
69.665
+1.065
1.55%
jan 1, 2010
63.739
-5.926
-8.51%
jan 1, 2011
65.01
+1.271
1.99%
jan 1, 2012
66.611
+1.601
2.46%
jan 1, 2013
64.547
-2.065
-3.1%
jan 1, 2014
58.649
-5.898
-9.14%
jan 1, 2015
52.451
-6.198
-10.57%
Ranking of countries by current statistics by years


Comments: