29
/
en
AIzaSyAYiBZKx7MnpbEhh9jyipgxe19OcubqV5w
April 1, 2024
123777
Ecuador
ECU
true
2
1
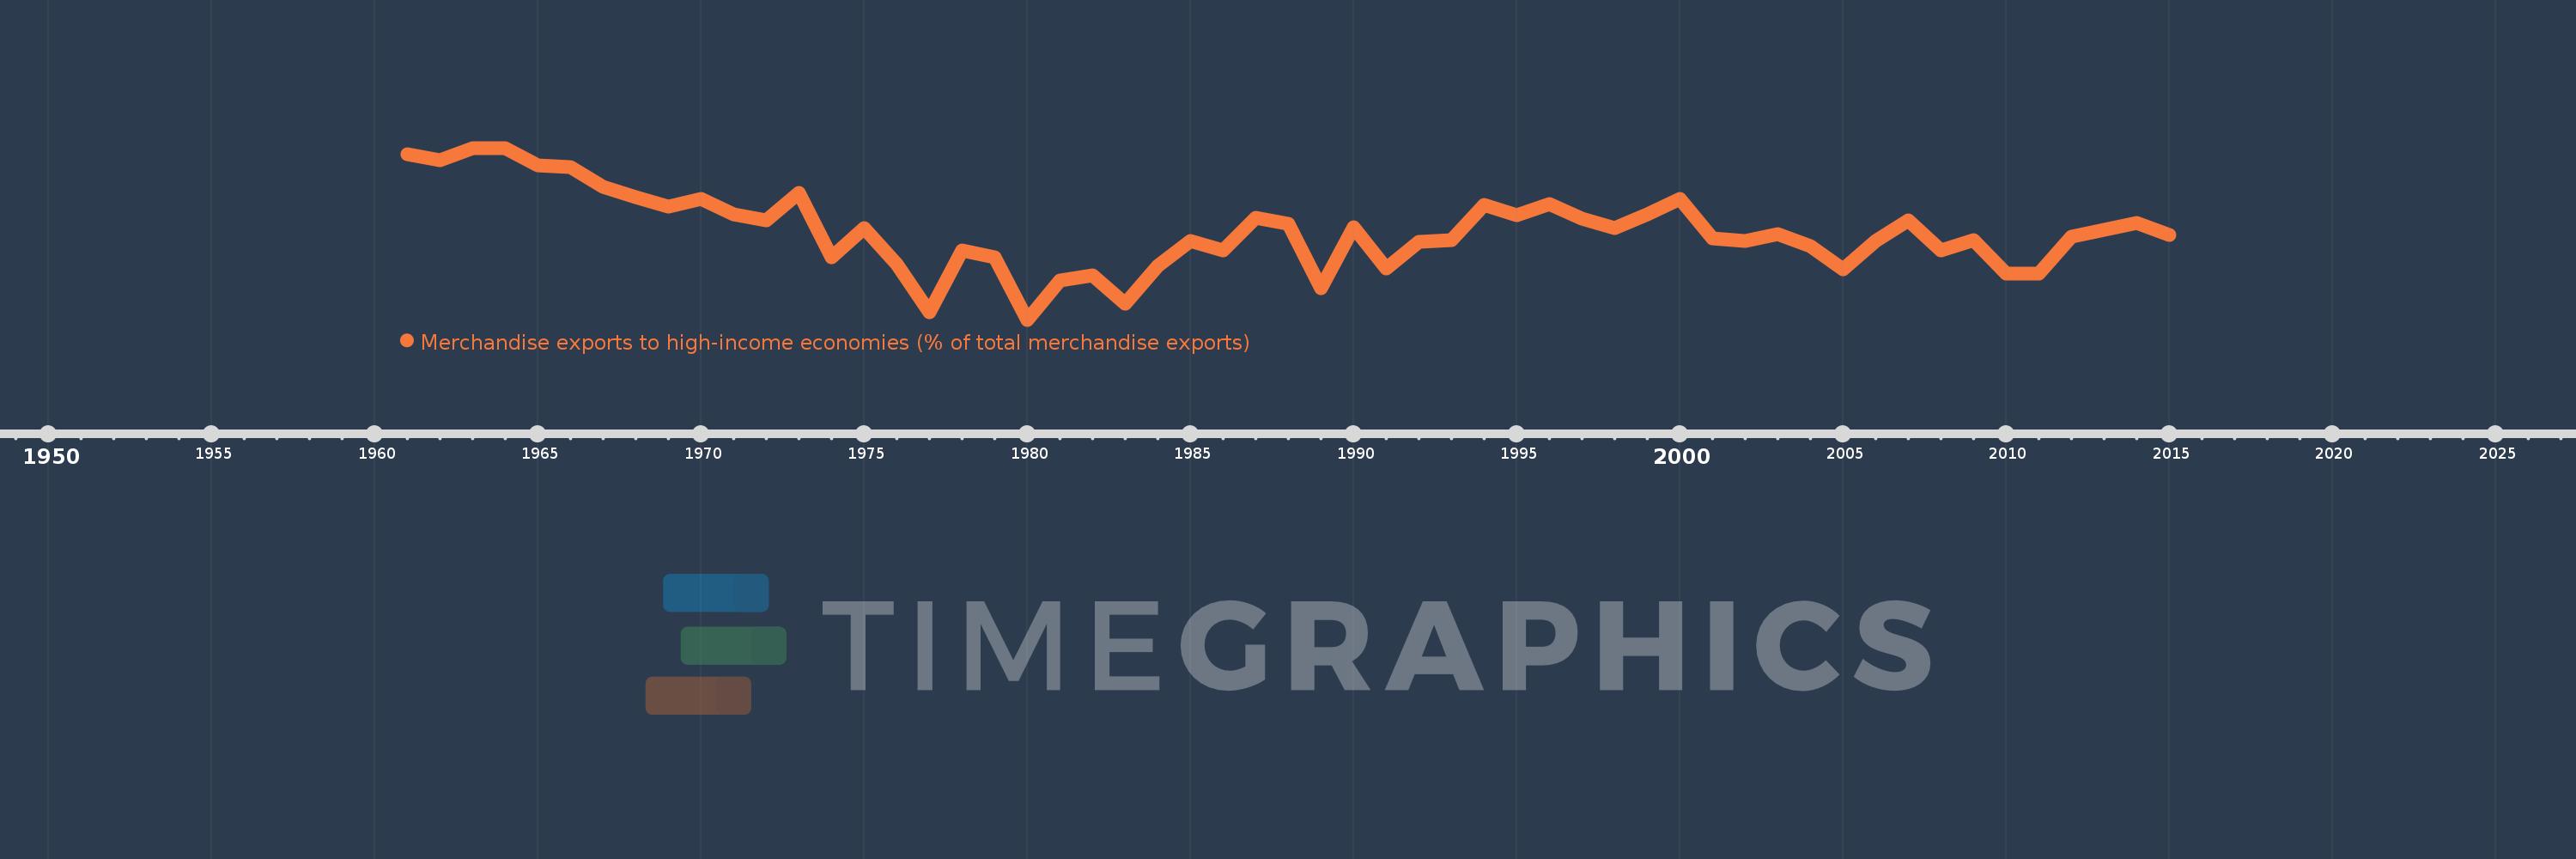
Merchandise exports to high-income economies (% of total merchandise exports)
2015,2014,2013,2012,2011,2010,2009,2008,2007,2006,2005,2004,2003,2002,2001,2000,1999,1998,1997,1996,1995,1994,1993,1992,1991,1990,1989,1988,1987,1986,1985,1984,1983,1982,1981,1980,1979,1978,1977,1976,1975,1974,1973,1972,1971,1970,1969,1968,1967,1966,1965,1964,1963,1962,1961
This statistics in other country:
AfghanistanAlbaniaAlgeriaAmerican SamoaAngolaAntigua and BarbudaArab WorldArgentinaArmeniaArubaAustraliaAustriaAzerbaijanBahamas, TheBahrainBangladeshBarbadosBelarusBelgiumBelizeBeninBermudaBoliviaBosnia and HerzegovinaBrazilBrunei DarussalamBulgariaBurkina FasoBurundiCabo VerdeCambodiaCameroonCanadaCaribbean small statesCentral African RepublicCentral Europe and the BalticsChadChileChinaColombiaComorosCongo, Dem. Rep.Congo, Rep.Costa RicaCote d'IvoireCroatiaCubaCyprusCzech RepublicDenmarkDjiboutiDominicaDominican RepublicEarly-demographic dividendEast Asia & PacificEast Asia & Pacific (excluding high income)East Asia & Pacific (IDA & IBRD countries)EcuadorEgypt, Arab Rep.El SalvadorEquatorial GuineaEstoniaEthiopiaEuro areaEurope & Central AsiaEurope & Central Asia (excluding high income)Europe & Central Asia (IDA & IBRD countries)European UnionFaroe IslandsFijiFinlandFragile and conflict affected situationsFranceFrench PolynesiaGabonGambia, TheGeorgiaGermanyGhanaGibraltarGreeceGreenlandGrenadaGuamGuatemalaGuineaGuinea-BissauGuyanaHaitiHeavily indebted poor countries (HIPC)High incomeHondurasHong Kong SAR, ChinaHungaryIBRD onlyIcelandIDA & IBRD totalIDA blendIDA onlyIDA totalIndiaIndonesiaIran, Islamic Rep.IraqIrelandIsraelItalyJamaicaJapanJordanKazakhstanKenyaKiribatiKorea, Dem. People’s Rep.Korea, Rep.KosovoKuwaitKyrgyz RepublicLao PDRLate-demographic dividendLatin America & Caribbean Latin America & Caribbean (excluding high income)Latin America & the Caribbean (IDA & IBRD countries)LatviaLeast developed countries: UN classificationLebanonLiberiaLibyaLithuaniaLow & middle incomeLow incomeLower middle incomeLuxembourgMacao SAR, ChinaMacedonia, FYRMadagascarMalawiMalaysiaMaldivesMaliMaltaMauritaniaMauritiusMexicoMiddle East & North AfricaMiddle East & North Africa (excluding high income)Middle East & North Africa (IDA & IBRD countries)Middle incomeMoldovaMongoliaMontenegroMoroccoMozambiqueMyanmarNauruNepalNetherlandsNew CaledoniaNew ZealandNicaraguaNigerNigeriaNorth AmericaNorwayOECD membersOmanOther small statesPacific island small statesPakistanPanamaPapua New GuineaParaguayPeruPhilippinesPolandPortugalPost-demographic dividendPre-demographic dividendQatarRomaniaRussian FederationRwandaSamoaSao Tome and PrincipeSaudi ArabiaSenegalSerbiaSeychellesSierra LeoneSingaporeSlovak RepublicSloveniaSmall statesSolomon IslandsSomaliaSouth AfricaSouth AsiaSouth Asia (IDA & IBRD)SpainSri LankaSt. Kitts and NevisSt. LuciaSt. Vincent and the GrenadinesSub-Saharan Africa Sub-Saharan Africa (excluding high income)Sub-Saharan Africa (IDA & IBRD countries)SudanSurinameSwedenSwitzerlandSyrian Arab RepublicTajikistanTanzaniaThailandTogoTongaTrinidad and TobagoTunisiaTurkeyTurkmenistanTuvaluUgandaUkraineUnited Arab EmiratesUnited KingdomUnited StatesUpper middle incomeUruguayUzbekistanVanuatuVenezuela, RBVietnamWorldYemen, Rep.ZambiaZimbabwe Timeline:
This timeline shows a graph from 1961 to 2015 of Ecuador. No data until 1960. Number of actual observations by date: 55.
Source name:
World Development Indicators
Source organization:
World Bank staff estimates based data from International Monetary Fund's Direction of Trade database.
Categories, topics:
Private Sector, Trade
Last updated:
apr 23, 2017
Indicators value changes by year
Minimum:
57.014
jan 1, 1980
Maximum:
91.911
jan 1, 1964
At the date of observation
Value
Absolute change
Change from previous value
jan 1, 1961
90.675
+90.675
0.0%
jan 1, 1962
89.43
-1.245
-1.37%
jan 1, 1963
91.866
+2.436
2.72%
jan 1, 1964
91.911
+0.044
0.05%
jan 1, 1965
88.435
-3.476
-3.78%
jan 1, 1966
88.073
-0.362
-0.41%
jan 1, 1967
83.968
-4.105
-4.66%
jan 1, 1968
81.903
-2.065
-2.46%
jan 1, 1969
79.943
-1.96
-2.39%
jan 1, 1970
81.645
+1.703
2.13%
jan 1, 1971
78.359
-3.286
-4.02%
jan 1, 1972
77.165
-1.195
-1.52%
jan 1, 1973
82.829
+5.664
7.34%
jan 1, 1974
69.738
-13.091
-15.8%
jan 1, 1975
75.691
+5.953
8.54%
jan 1, 1976
68.264
-7.427
-9.81%
jan 1, 1977
58.568
-9.697
-14.2%
jan 1, 1978
71.092
+12.524
21.38%
jan 1, 1979
69.765
-1.327
-1.87%
jan 1, 1980
57.014
-12.751
-18.28%
jan 1, 1981
64.903
+7.889
13.84%
jan 1, 1982
66.025
+1.122
1.73%
jan 1, 1983
60.262
-5.763
-8.73%
jan 1, 1984
67.958
+7.696
12.77%
jan 1, 1985
72.975
+5.017
7.38%
jan 1, 1986
71.176
-1.799
-2.47%
jan 1, 1987
77.757
+6.581
9.25%
jan 1, 1988
76.504
-1.253
-1.61%
jan 1, 1989
63.486
-13.017
-17.02%
jan 1, 1990
75.883
+12.397
19.53%
jan 1, 1991
67.486
-8.398
-11.07%
jan 1, 1992
72.788
+5.302
7.86%
jan 1, 1993
73.108
+0.32
0.44%
jan 1, 1994
80.269
+7.161
9.79%
jan 1, 1995
78.25
-2.019
-2.51%
jan 1, 1996
80.584
+2.334
2.98%
jan 1, 1997
77.501
-3.083
-3.83%
jan 1, 1998
75.644
-1.857
-2.4%
jan 1, 1999
78.504
+2.861
3.78%
jan 1, 2000
81.525
+3.021
3.85%
jan 1, 2001
73.482
-8.044
-9.87%
jan 1, 2002
72.99
-0.492
-0.67%
jan 1, 2003
74.333
+1.343
1.84%
jan 1, 2004
71.993
-2.34
-3.15%
jan 1, 2005
67.334
-4.659
-6.47%
jan 1, 2006
73.082
+5.748
8.54%
jan 1, 2007
77.184
+4.103
5.61%
jan 1, 2008
71.019
-6.165
-7.99%
jan 1, 2009
73.241
+2.222
3.13%
jan 1, 2010
66.344
-6.897
-9.42%
jan 1, 2011
66.38
+0.036
0.05%
jan 1, 2012
73.941
+7.561
11.39%
jan 1, 2013
75.261
+1.32
1.78%
jan 1, 2014
76.737
+1.476
1.96%
jan 1, 2015
74.185
-2.552
-3.33%
Ranking of countries by current statistics by years


Comments: